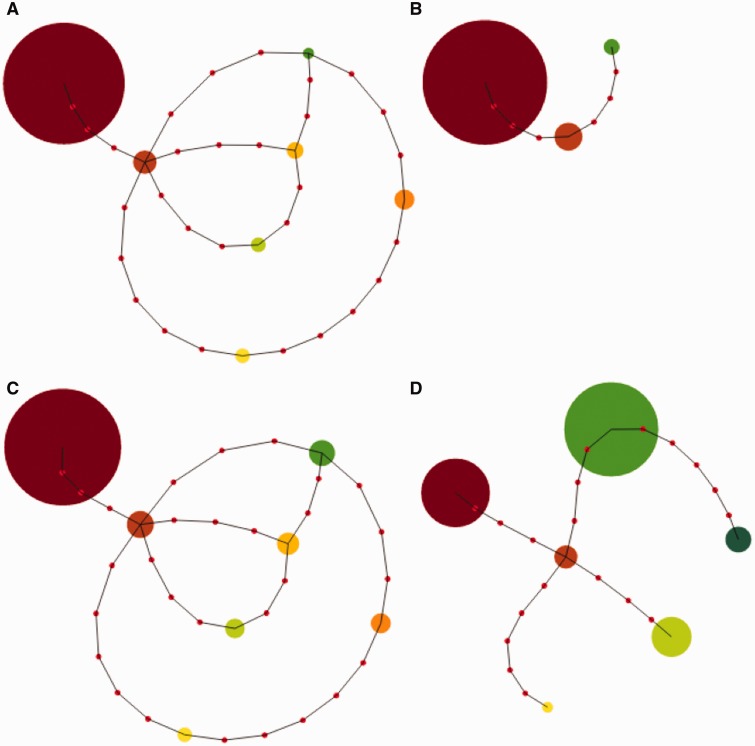
Figure 6.
Genetic relationships between parasite haplotypes in one Tanzanian patient. Pseudo minimum spanning tree figure showing the number of nucleotide differences (red dots) between haplotypes (circles) with the minimum number of mismatches and their ties shown to include all haplotypes in the graph for patient T40. Haplotypes are colored as in Fig. 3 (second row from the bottom) and the size of the circle corresponds to the relative abundance of that haplotype at (A) 0 h, (B) 24 h, (C) 48 h and (D) 72 h after the start of drug treatment. Across time points, the total area of the circles is constant

