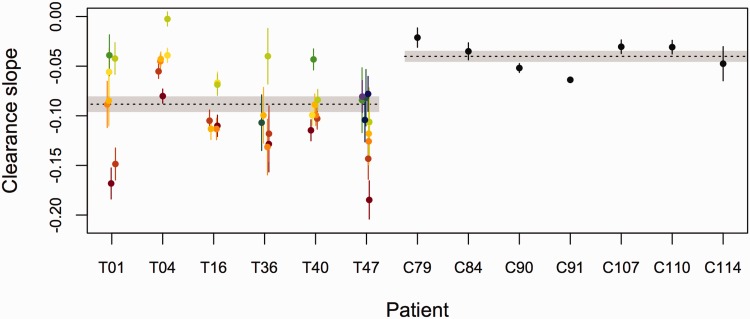
Figure 8.
Comparison of clearance slopes of parasites isolated from patients in Tanzania (patient IDs beginning with T) and Cambodia (patient IDs beginning with C). For patients from Tanzania, in which significant variation in clearance rates was observed, the predicted clearance slopes ±1 standard error of individual subpopulations are given in different colors. There was no significant variation in infections from Cambodia. The dashed lines (shaded region) represent the mean (±1 standard error of the mean) clearance slopes of patients from each region, as estimated by fitting linear models to the decline in loge total parasite density

