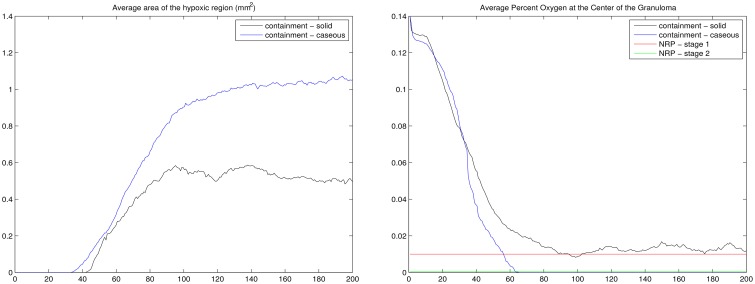
Figure 7.
For the containment granuloma: average area of the hypoxic region in mm2 (Left) and the average percent of oxygen in tissue at the center of the granuloma (Right). Containment granulomas were divided into two groups: caseous and solid. NRP stages (Wayne and Hayes, 1996) are notated (right). Results based on 20 simulation runs.

