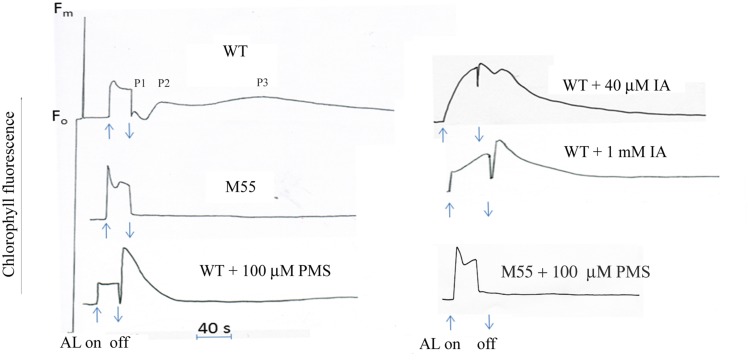
FIGURE 1.
Kinetics of post-illumination increase in Chl fluorescence. The Top curve shows a typical trace of chlorophyll fluorescence in wild type (WT) Synechocystis PCC 6803. The cell at mid-logarithmic stage (OD730 ≈ 0.5) was pipetted in a cuvetter with a thermostat. After the cells were exposed to the AL (3 Wm-2) for 30 s, the transient increase kinetics in chlorophyll fluorescence was detected. The wild type showed the oscillation kinetics of post-illumination increase in Chl fluorescence: a fast phase, peak1 (P1) followed by one or two slow phase peak2 (P2) or peak3 (P3). M55, NdhB defective mutant; PMS, phenazine methosulphate; IA, iodoacetamide. Each sample was adapted in the dark for 2 min prior to the measurement. The chemicals were, respectively, added to the sample before adaptation in the dark. Every experiment was independently repeated three times at least.

