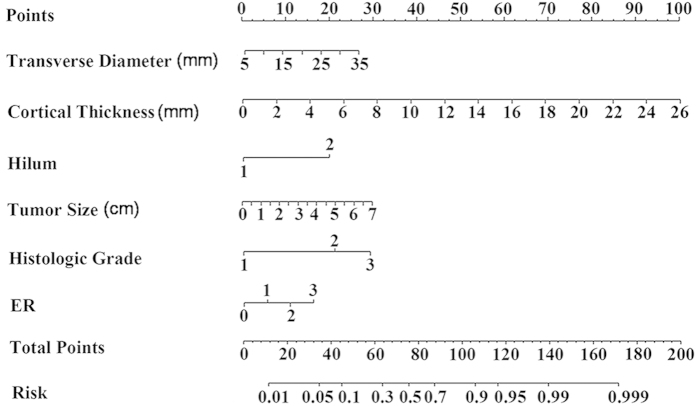
Figure 2. Nomogram for predicting the probability of axillary lymph node metastasis.
The nomogram comprises nine rows. The first row is the point assignment for each variable. For an individual patient, each variable is assigned a point value according to the clinicopathological characteristics by drawing a vertical line between the exact variable value and the Points line. Subsequently, a total point (row 8) can be obtained by summing all of the assigned points for the six variables. Finally, the predictive probability of axillary metastasis can be obtained by drawing a vertical line between Total Points and Risk (the final row).

