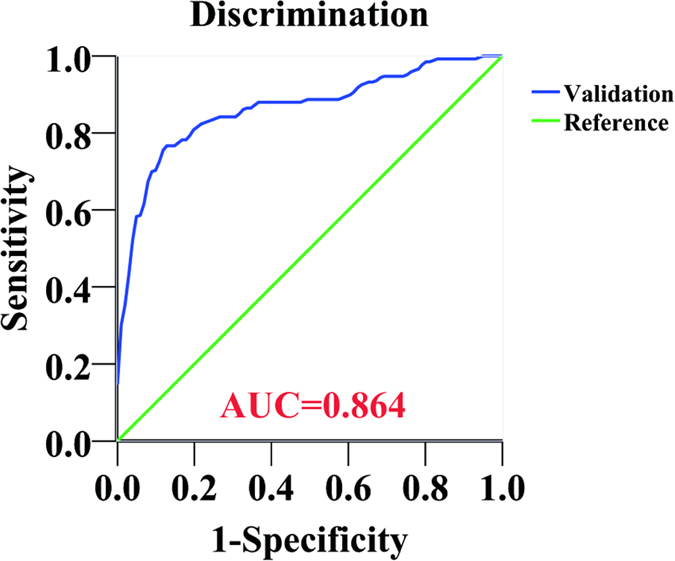
Figure 4. Receiver-operating characteristic (ROC) curve of the predictive model for the validation group.

The reference line with a slope of 1 indicates an area under the ROC curve value of 0.5, which means that the probability of axillary lymph node (ALN) metastasis is equal to the toss of a coin. An area under the ROC curve (AUC) value of 1 represents perfect discrimination of a patient with positive ALN from the one with negative ALN. The model showed good performance with AUC of 0.864.
