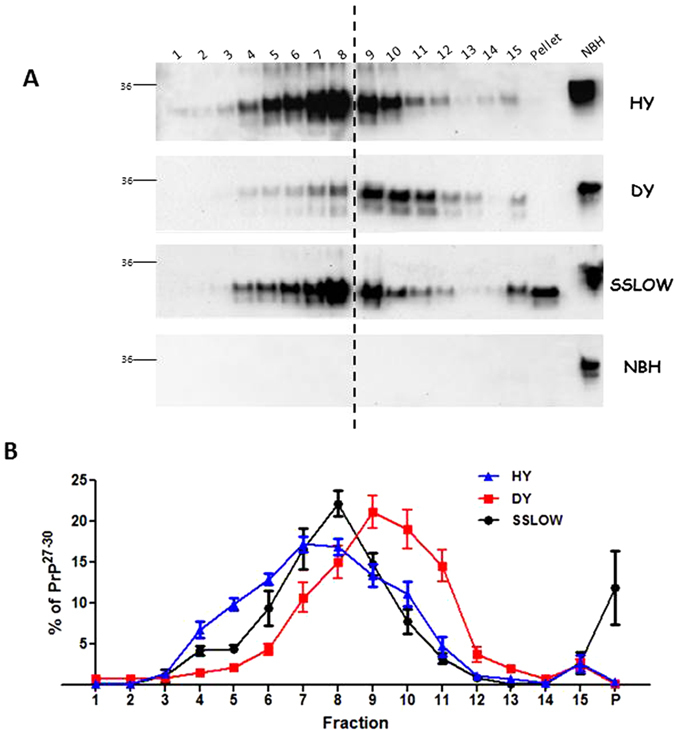
Figure 1. Sucrose-gradient fractionation of HY, DY and SSLOW prions.

Brain homogenates from clinically sick (stage 4) hamsters were submitted to sucrose gradient fractionations coupled to ultracentrifugation. Fractionated samples were PK treated and analyzed by Western blot. (A) Representative blots from five (HY, DY) or three (SSLOW, NBH) fractionated brain extracts (obtained from different animals). Horizontal lines at the left of each blot represent a 36 KDa molecular weight marker. Vertical dotted lines depict splicing from different blots developed in the same membrane. Numbers at the top of the blots represent fraction numbers (from top to bottom). NBH: Normal (non-infected) brain homogenate. (B) Fractionation profiles for each prion strain as indicated. Values correspond to the average ± standard error calculated from values obtained by a single fractionation procedure per infected brain homogenates (n = 5 for HY and DY; n = 3 for SSLOW).
