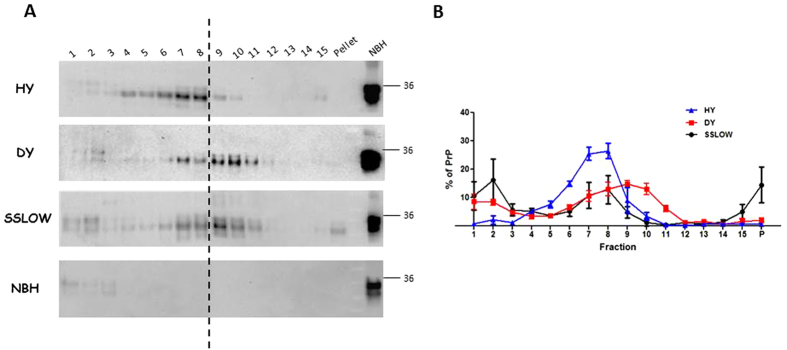
Figure 2. Sucrose-gradient fractionation of HY, DY and SSLOW prions in the absence of PK treatment.
The same fractionated samples depicted in Fig 1 were analyzed for their PrP content in the absence of PK treatment. (A) Representative Western blots of the samples analyzed. The presence of PrPC in fractions 1 and 2 is appreciated in all samples. Horizontal line at the right of the blot represents a 36 KDa molecular weight marker. Numbers at the top of the blots represent fraction numbers (from top to bottom). Vertical dotted lines represent blot splicing. (B) Fractionation profiles for samples corresponding to HY, DY and SSLOW prions developed without PK treatment. Data is represented as averages ± standard errors.

