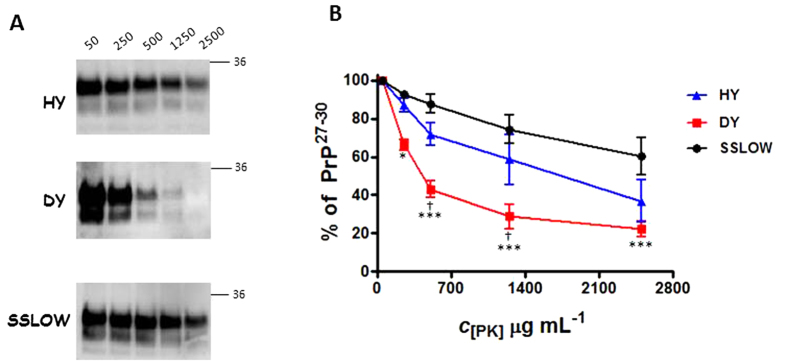
Figure 5. PK degradation profile of HY, DY and SSLOW prions.
Extracts from HY, DY and SSLOW brains were treated with increasing concentrations of PK and remaining PrP27,28,29,30 was measured by analyzing the signal obtained after Western blotting. (A) Representative pictures of differential PK treatment for the three prion strains. Horizontal lines at the right of each blot indicate a 36 KDa molecular weight standard. Numbers at the top represent final PK concentrations in μg/mL. (B) PK resistance profile for HY, DY and SSLOW prions are represented as averages ± standard errors of three different measurements. No significant differences were found for HY and SSLOW prions at any PK concentration. (DY vs. HY prions: †p < 0.05; DY vs. SSLOW prions: *p < 0.05, ***p < 0.001).

