Figure 5.

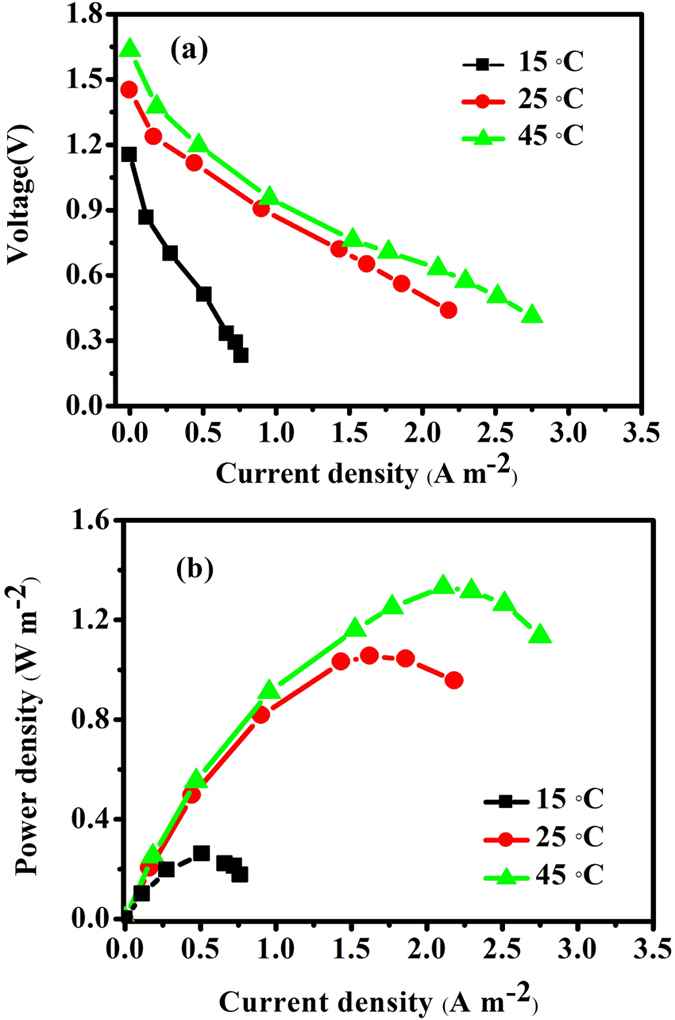
Polarization curve (a) and power profiles (b) at different temperatures. (15 °C (■), 25 °C (●), 45 °C (▲) and fixing the anolyte at 0. 2 M NaBH4 in 1 M NaOH and catholyte at 400 mg L−1 Cu2+ in 0.5 M HAC-NaAC (pH = 3.5).

Polarization curve (a) and power profiles (b) at different temperatures. (15 °C (■), 25 °C (●), 45 °C (▲) and fixing the anolyte at 0. 2 M NaBH4 in 1 M NaOH and catholyte at 400 mg L−1 Cu2+ in 0.5 M HAC-NaAC (pH = 3.5).