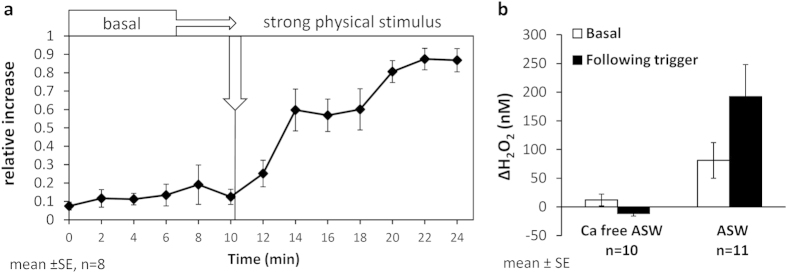
Figure 4. Rapid H2O2 release from S. pistillata following strong physical stimulus.
(a) Relative increase in H2O2 before applying the stimulus (basal) and following strong physical stimulus. (b) Similar experiments were also run in artificial seawater (ASW) and in Calcium-free ASW (panel b). The bars in panel b represent the change in H2O2 concentrations over 10 min, prior to stimulus (basal; white bars) and following it (black bars).

