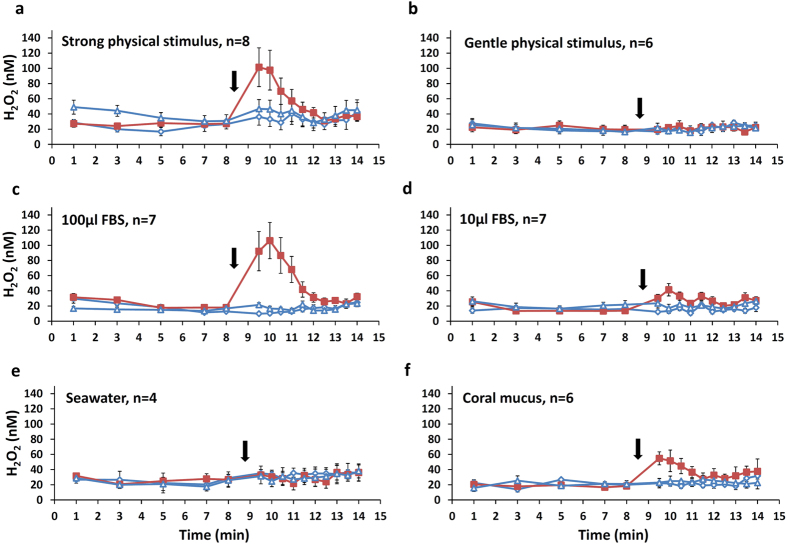
Figure 6. Rapid and localized release of H2O2 following different treatments.
H2O2 concentrations were measured at three locations near the coral surface. The corals were treated at only one location (red squares) while at two locations no treatment was applied (empty triangles and diamonds). Treatment was applied at eight minute (black arrows) and the coral response to stimuli examined until min 14. The treatments included strong and gentle physical stimuli (a,b), Fetal Bovine Serum at different concentrations (FBS, c,d), seawater (e) and coral mucus (f). Values are means (±SE) of 4–8 repeats as labeled.

