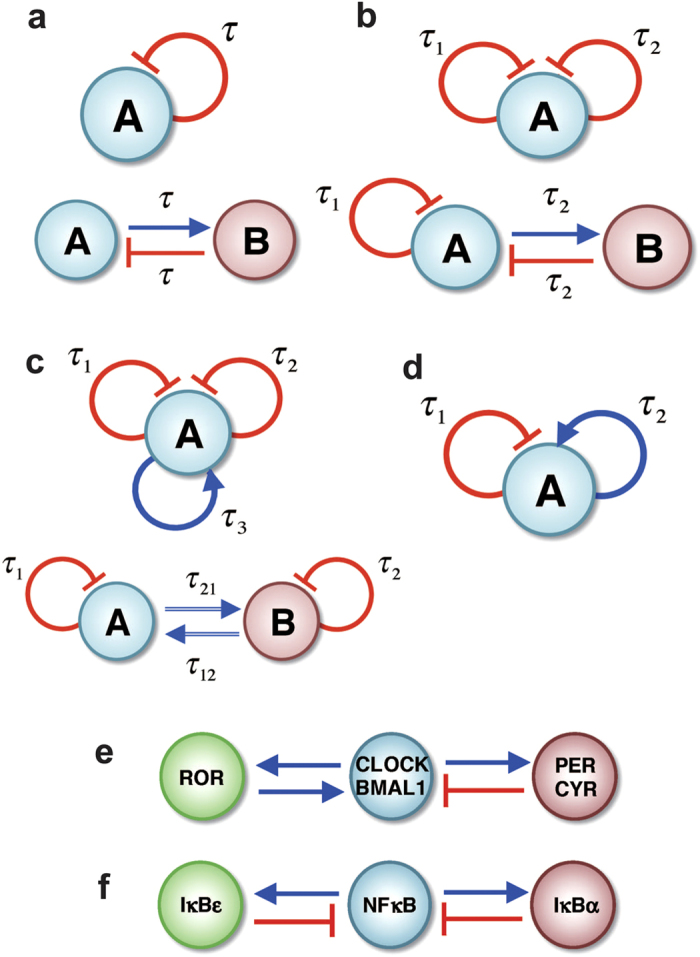
Figure 1. A list of circuit motifs used in this study.

The light blue and light red circles represent genes A and B, respectively. The blue lines with arrows represent transcriptional activation and the red lines with bars represent transcriptional inhibition. A symbol τ along each line represents the time delay in the interaction. In the Results, we show that different groups of circuit motifs exhibit unique dynamics. (a) shows motifs with a negative feedback loop. These one-gene and two-gene elements exhibit periodic oscillations. (b) shows motifs with two negative feedback loops. They exhibit periodic, quasi-periodic and weak chaotic dynamics. (c) shows motifs with two negative feedback loops and a positive feedback loop. They exhibit periodic, quasi-periodic, weak chaotic, and strong chaotic dynamics. (d) shows a one-gene element with both self-activation and self-inhibition. For certain parameter range, the motif may exhibit intermittent dynamics between periodic and weak chaotic mode. Intermittency between weak chaotic and strong chaotic mode was also found for the circuit motif in the upper panel of (c). Panel (e) and (f) show the core circadian clock gene circuit and the NFκB gene circuit respectively.
