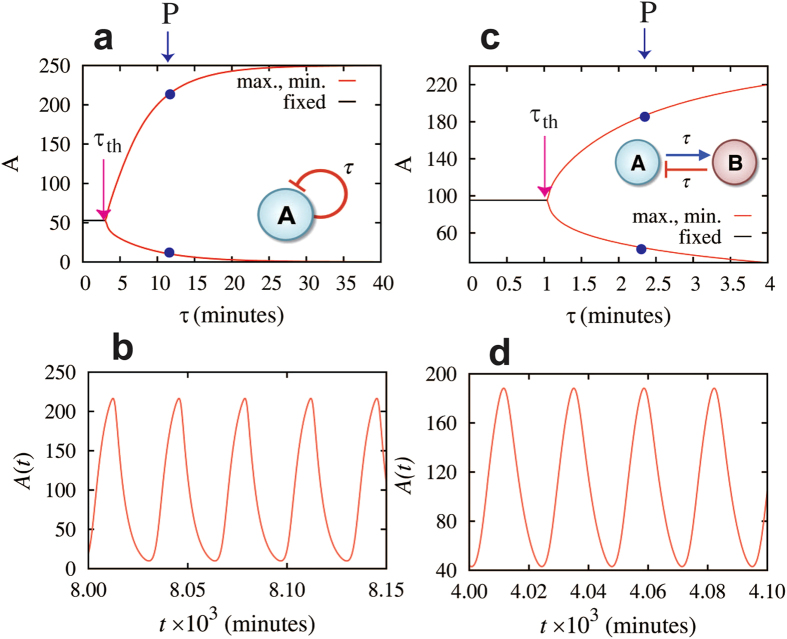
Figure 3. Oscillatory dynamics for elements with one delayed negative feedback loop.
Left panels show the results for the element of the gene A with self-inhibition (inset of (a)); right panels are for the flip-flop element (two genes A and B with a forward activation and backward inhibition, inset of (c)). (a) and (c) show bifurcation diagrams of the fixed point (black line), the maximum level (upper red line), and minimum level (lower red line) of protein A with respect to different values of the time delay τ. When τ is less than the Hopf bifurcation point τth (3.1 minutes in (a) and 1.05 minutes in (c)), the circuits are in a steady state (black line for levels of protein A). When τ is larger than τth, the circuit has dynamics of periodic oscillations. (b) and (d) show the time trajectories of the corresponding circuits illustrated in (a) and (c), where the time delays τ are set to τ = 12 minutes in (b) and τ = 2.4 minutes in (d) (blue points and arrows in (a) and (c)).

