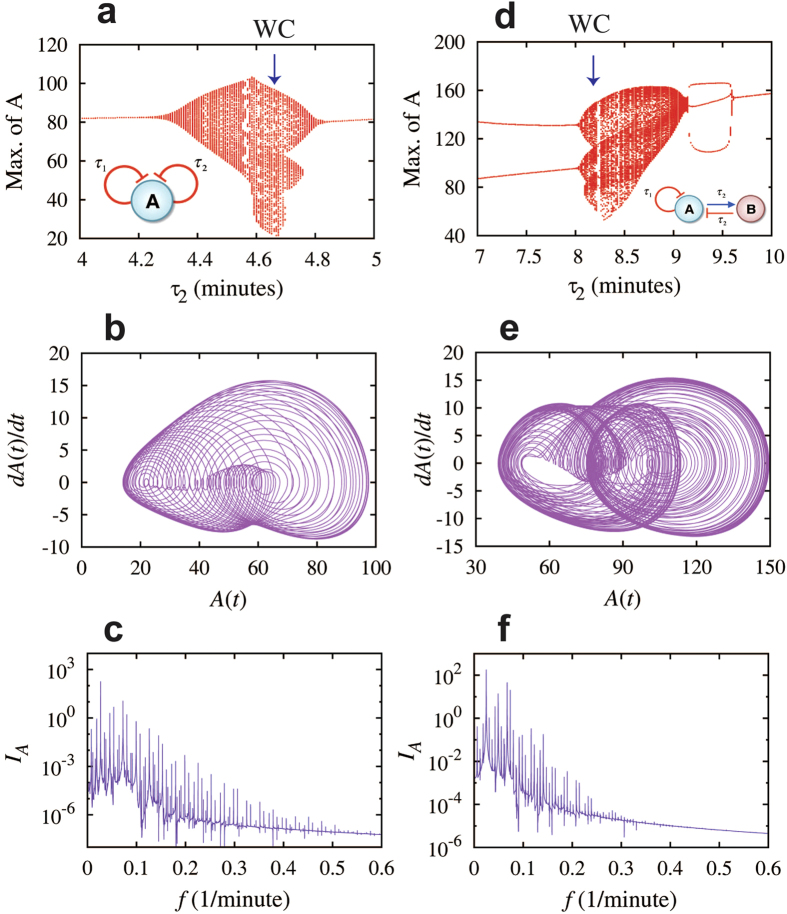
Figure 4. Weak chaotic dynamics for elements with two negative feedback loops.
Left panels show the results for the element of the gene A with two delayed self-inhibitions (circuit diagram in inset of (a)). Panel (a) shows bifurcation of the maximum levels of protein A with respect to the values of time delay τ2 while fixing the time delay τ1 = 18 minutes. The dynamics is periodic when τ2 < 4.2 minutes or τ2 > 4.9 minutes, and quasi-periodic or weak chaotic dynamics otherwise. Panels (b) and (c) show the A(t) – dA(t)/dt maps and the full spectra of the protein level A for the case when τ1 = 18 minutes, τ2 = 4.65 minutes (navy arrow in (a)). Right panels show the results for the two-gene flip-flop element with time delays (circuit diagram in inset of (d)). Panels (d–f) are similar to panels (a–c). In the bifurcation diagram in (d), the time delay τ1 is fixed to be 5.3 minutes. The dynamics is periodic when τ2 < 8.0 minutes or τ2 > 9.18 minutes, and quasi-periodic or weak chaotic dynamics otherwise. Panels (e) and (f) are for the case when τ1 = 5.3 minutes, τ2 = 8.2 minutes (navy arrow in (d)). Circuits in both cases exhibit weak chaotic dynamics as illustrated by the maps (b,e), the full spectra (c,f) and the maximum-minimum spectra (see Supplementary section SI2).

