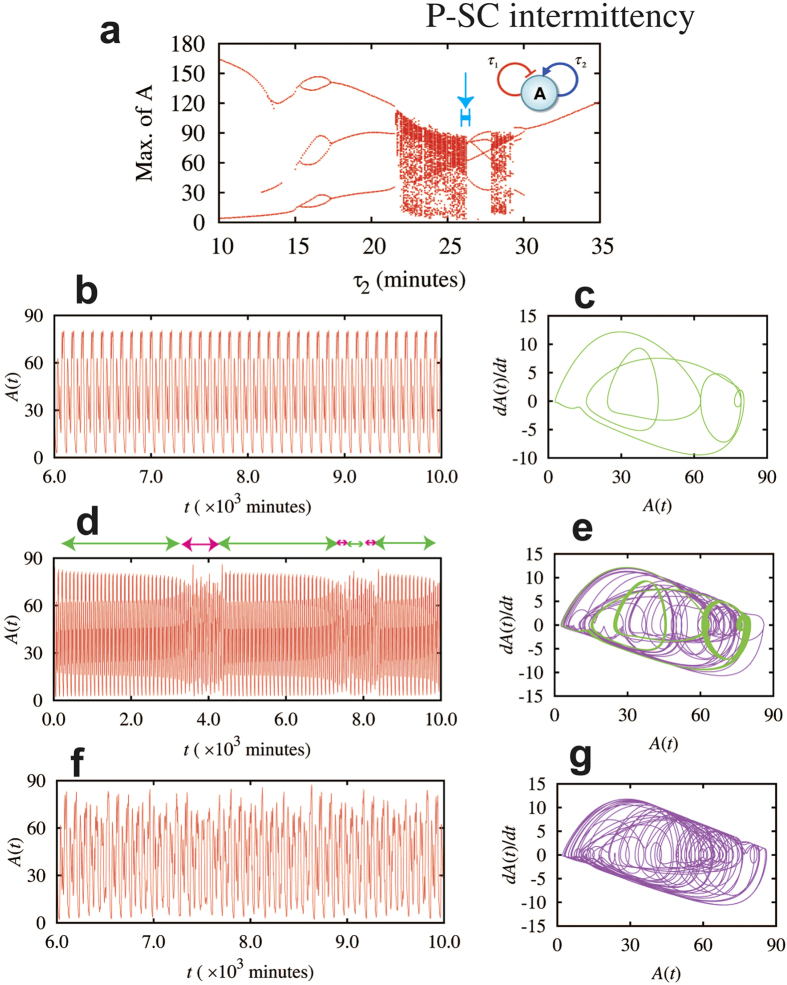
Figure 6. Intermittent dynamics between periodic and strong chaotic modes for a one-gene element with both self-inhibition and self-activation.
The diagram of this element is shown in inset of panel (a). Panel (a) shows the bifurcation diagram of the maximum levels of protein A with respect to the time delay τ2 when τ1 is set to be 26.0 minutes. Here we calculated dynamics for cases in which τ2 values are selected to be slightly different, but all close to 26.0 minutes (the second row: τ2 = 26.3 minutes, the third row: τ2 = 26.29 minutes, the fourth row: τ2 = 26.0 minutes). A blue line with bars (pointed by a blue arrow) in panel (a) indicates the range of time delays in these cases. Panels (b), (d), and (f) show the time trajectories, and panels (c), (e), and (g) show the A(t) – dA(t)/dt maps. The green and purple lines in the phase-space map represent periodic and chaotic dynamics, respectively. When τ2 = 26.3 minutes (the second row), the circuit has periodic oscillatory dynamics; when τ2 = 26.0 minutes, the circuit has strong chaotic dynamics. Interestingly, when τ2 is in between (e.g. the third row), the circuit has intermittent dynamics between periodic and strong chaotic modes. In the time periods indicated by the green bidirectional arrows in (d), the circuit exhibits periodic oscillation with decayed amplitudes. The green line in (e) corresponds to the dynamics from 5.0 × 10³ to 6.5 × 10³ minutes in (d). The green line appears thick, because it consists of many oscillations with slightly different amplitudes. The magenta bidirectional arrows indicate time periods of strong chaos. The purple line in (e) corresponds to the time trajectory from 3.6 × 10³ to 4.4 × 10³ minutes, which is similar to the trajectory from a pure chaotic mode (panels (f), (g).

