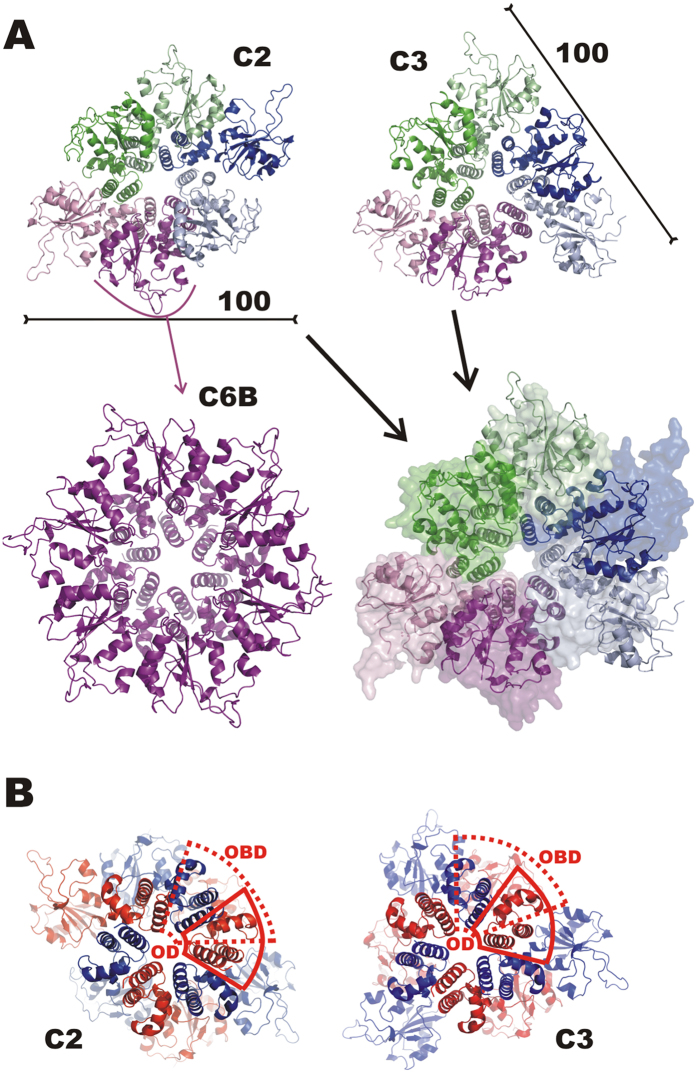
Figure 1. OBD conformations in the C2 and C3 crystal structures of RepB.
(A) Views on the OBDs of the cartoon representations of the respective C2 and C3 crystal structures and after superposition using the ODs of both (C2 structure shown as a transparent surface in the superposition). The C2 protomer that is hexamerised to give the C6B model is indicated. The scale bars indicate the approximate dimension. (B) Views on the ODs of the cartoon representation of the C2 and C3 structures along the C6 axis of the ODs. The protomers are now alternately coloured red and blue, the dashed and continuous red outlines mark the boundaries of the OBD and OD, respectively, of one of the protomers. The figure shows that the OD of a blue-coloured neighbouring protomer is partly located above the OBD of a red-coloured protomer.

