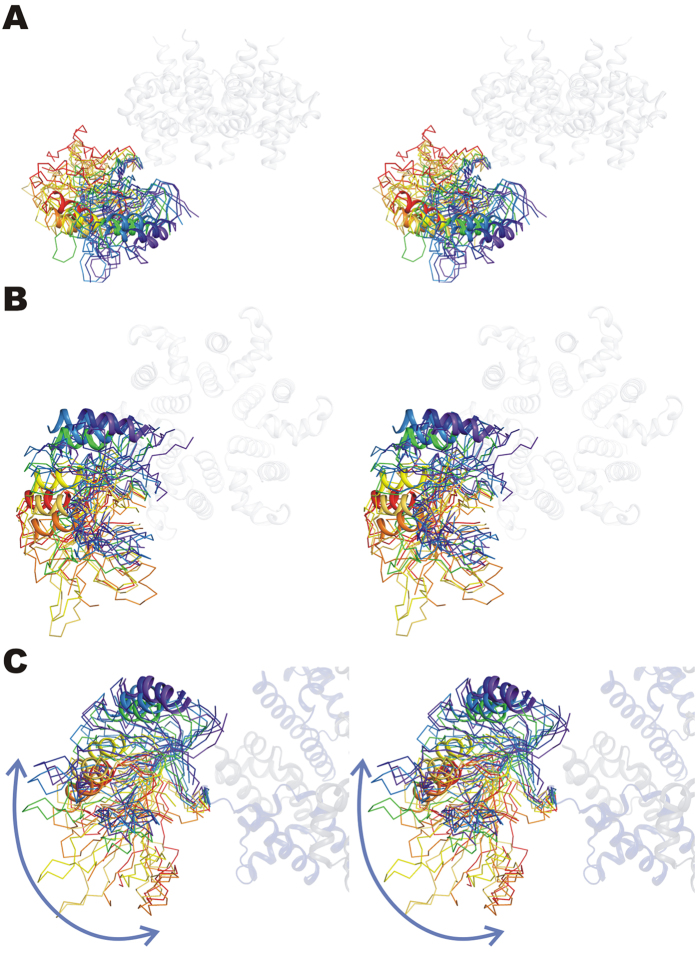
Figure 2. Superposition of the ODs of all nine protomers of the C2 and C3 structures showing the orientation of the OBDs with respect to the OD ring.
The OD hexamer is shown in blue and the different OBDs are represented by a ribbon, except for helix α2, which is drawn as a cartoon for visual reference. The OBDs are coloured from purple to red according to the distance to the central six-fold axis, where the OBD coloured purple is closest to that axis. (A) and (B) provide a lateral and a top view of the hexamer respectively, whereas (C) shows a view along the rotation axis relating the orientations of the OBDs.

