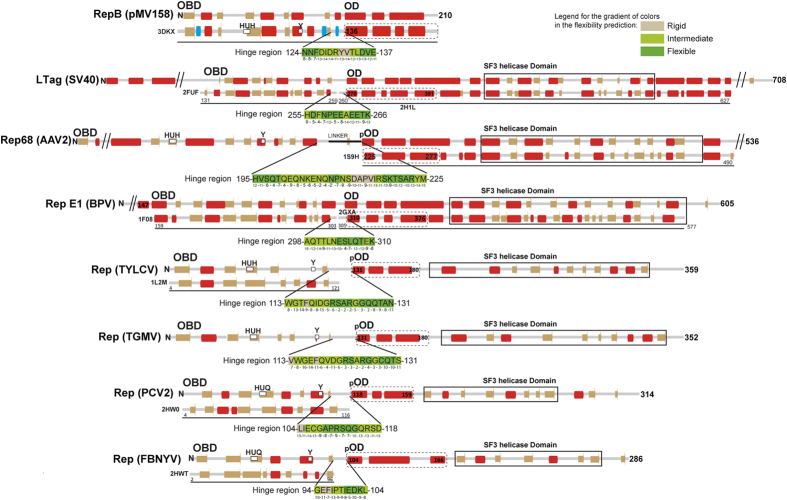
Figure 6. Predicted and observed secondary structure of the potential or defined domains of the pMV158 and viral Rep proteins discussed in the main text.
The amino-terminal end (N) and the number of amino acids are indicated for each protein analysed. The top horizontal line shows the result of the secondary structure prediction (predicted α-helices and β-strands are respectively represented by red and brown bars). The bottom horizontal line shows the observed secondary structure for the protein fragments whose structure is available (α-helices, β-strands and 310-helices are respectively represented by red, brown and blue bars). Conserved amino acid residues of the active site involved in metal binding (HUH) and in the endonucleolytic activity are indicated in the protein maps. The limits of the OBD, OD (either confirmed (OD) or potential (pOD) domain) and of the helicase domain are indicated in the protein maps. For RepB, AAV2 Rep, BPV E1 and SV40 LTag, the observed secondary structure of the ODs from the crystal structures are shown below the predicted secondary structure, preceded by the PDB entry code. Since there are no OBD structures available for the AAV2 and TGMV Reps, the C-terminal boundary of the OBD is shown as defined by alignment with the PF08724 and PF00799 Pfam families, respectively. Helicase domains of FBNYV and PCV2 Reps are defined by alignment with Pfam family PF00910 of SF3 helicases. The sequence and coordinates of the OBD-OD interdomain region that constitutes a potential hinge is indicated for every protein. The flexibility of each residue of the hinge predicted by the PredyFlexy35 server is represented by the gradient of colours indicated in the upper right corner of the figure. Grey colour represents a rigid residue whereas green and dark green colours represent residues with intermediate or high flexibility, respectively. The confidence index for the flexibility prediction is indicated for each residue just below the sequence. This index reflects the accuracy of the prediction and is represented by discrete values ranked from 1 to 19, with the prediction confidence increasing.

