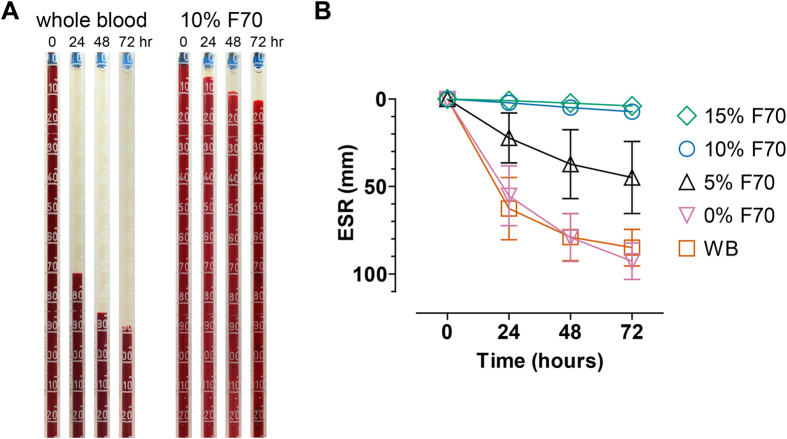
Figure 1.
(A) Representative images that show the measurement of ESR on WB (left) and blood that contains 10% F70 (right). Note that these images do not represent the entire length of the ESR assay. (B) ESR of blood samples in WB and blood containing different concentrations of F70 over 72 hours (WB, n = 11; 0% F70, n = 9; 5% F70, n = 8; 10% F70, n = 11; 15% F70, n = 9). 0% F70 represents the control condition which was treated with RPMI medium without F70. Error bars represent the 95% confidence interval (CI) of the mean.

