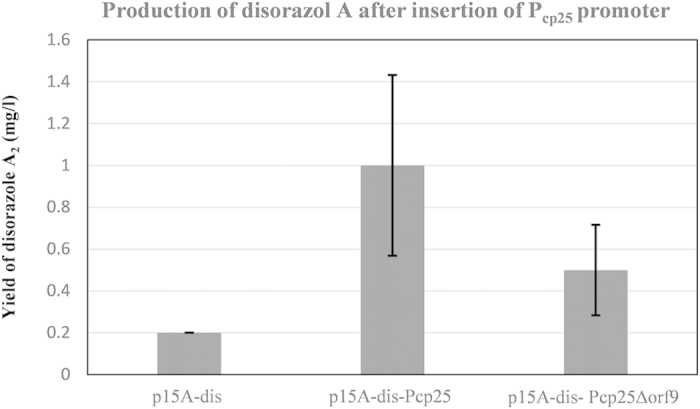
Figure 5. Production of disorazol A after insertion of Pcp25 promoter.

Quantification of disorazol heterologous production by HPLC-MS analysis of the culture extracts from different M. xanthus DK1622 mutant strains. All LC-MS- derived area values are normalized to the crude extracts of each sample by method of standard curves. The depicted values are mean values from three independent mutants. Error bars show calculated SDs, yield, control strain.
