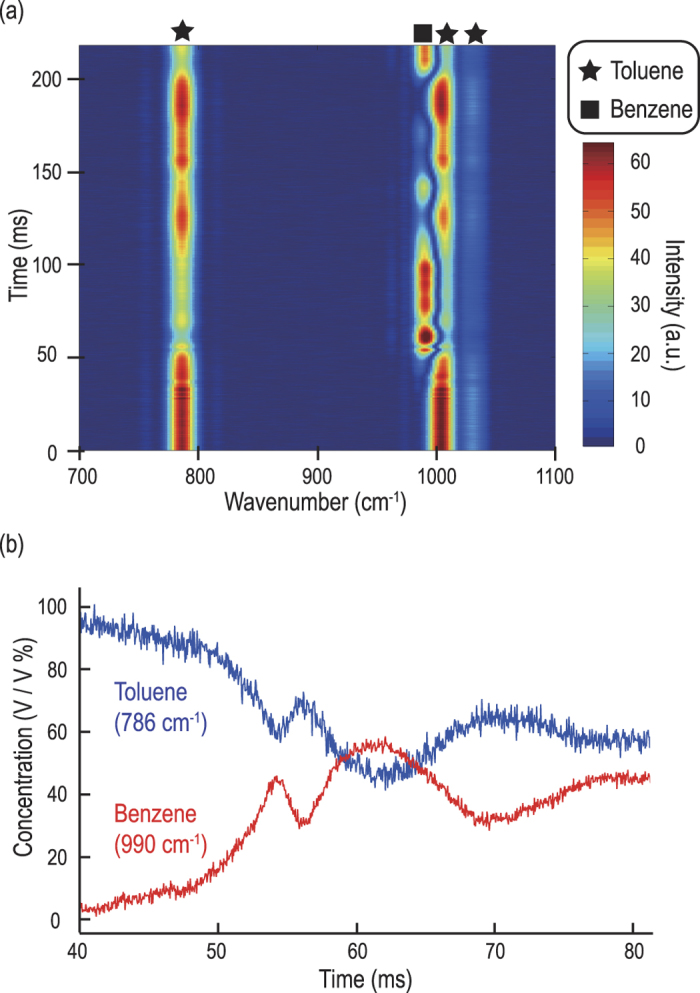
Figure 6. Mixing dynamics of toluene and benzene captured by the rapid-scanning FT-CARS system.

(a) Evolution of the CARS spectrum during the mixing process of toluene and benzene. Here benzene is added to and mixed with toluene. In the beginning, only the CARS signal of toluene is present whereas at a later time, the CARS signatures of the two species are present, indicating that they are mixed. (b) Temporal variations in the concentration of toluene and benzene.
