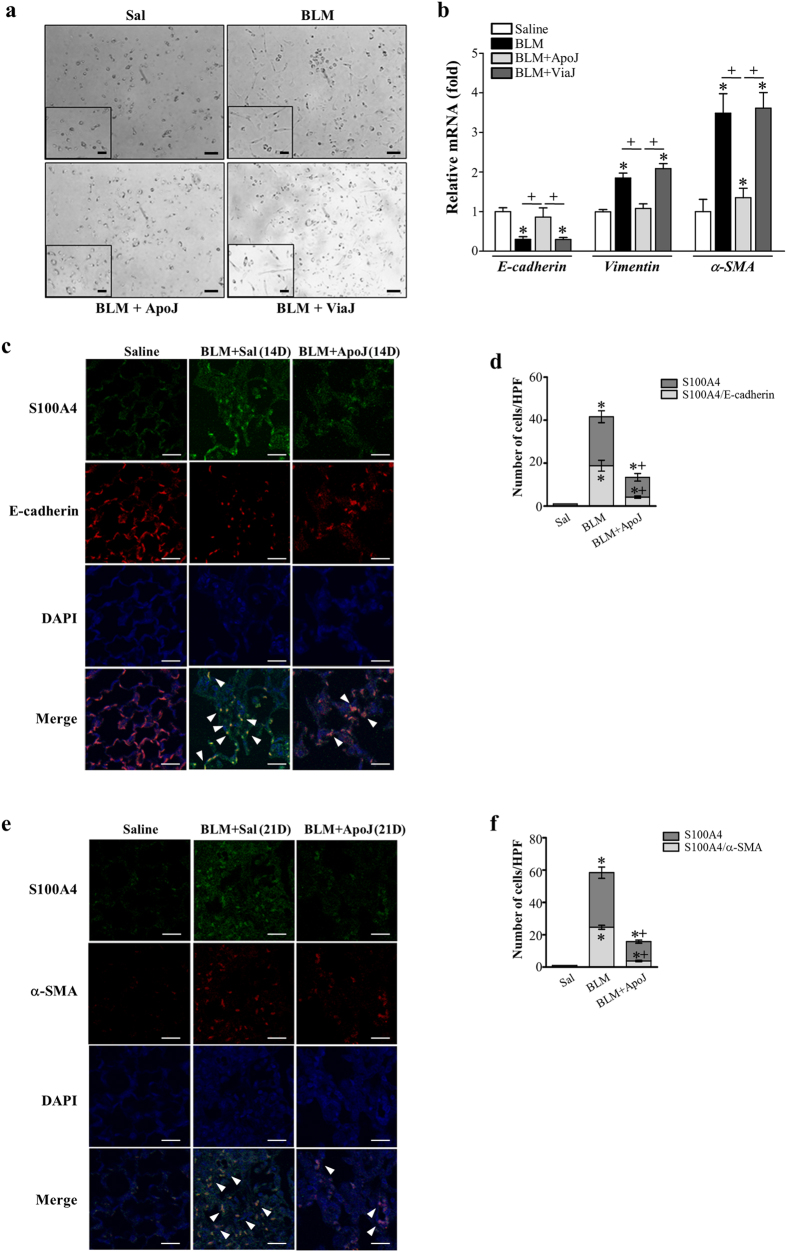
Figure 8. Reduction of EMT and fibrotic activation by in vivo instillation of apoptotic cells.
Two days after bleomycin (BLM) treatment, lungs were instilled with saline alone (Sal), viable Jurkat cells (ViaJ), or apoptotic Jurkat cells (ApoJ) intratracheally. Mice were euthanized on days 14 or 21 following BLM treatment. Primary mouse alveolar type II epithelial (AT II) cells were isolated from murine lungs at 14 days after BLM treatment. The extent of EMT was determined by assessing the morphological changes (Scale bars = 100 μm) (a) and mRNA expression profiles of E-cadherin, vimentin, and α-SMA (b). The mRNA abundance of these EMT markers was analyzed by real-time PCR in primary AT II cells from each group on day 14 after BLM treatment. Values represent the mean ± s.e.m. from five mice in each group. *P < 0.05 compared with control; +P < 0.05 as indicated. Immunofluorescence staining for E-cadherin (red), α-SMA (red), or fibroblast-specific protein-1 (S100A4, green) was performed in lung sections on days 14 (c) or 21 (e) following BLM treatment. Arrowheads indicate co-localization of E-cadherin or α-SMA in lung fibroblasts. The imaging medium was Vectashield fluorescence mounting medium containing DAPI. (c,e) Scale bars = 20 μm. Representative images were obtained from three mice in each group. Graph representing the number of double positive cells of S100A4 and E-cadherin or α-SMA compared with the total S100A4 positive cell population in lung parenchyma on days 14 (d) or 21 (f) after bleomycin treatment. Mean of 5 high power fields per section ± s.e.m. from three mice in each group. *P < 0.05 compared with control; +P < 0.05 for BLM + ApoJ vs. BLM + Sal.

