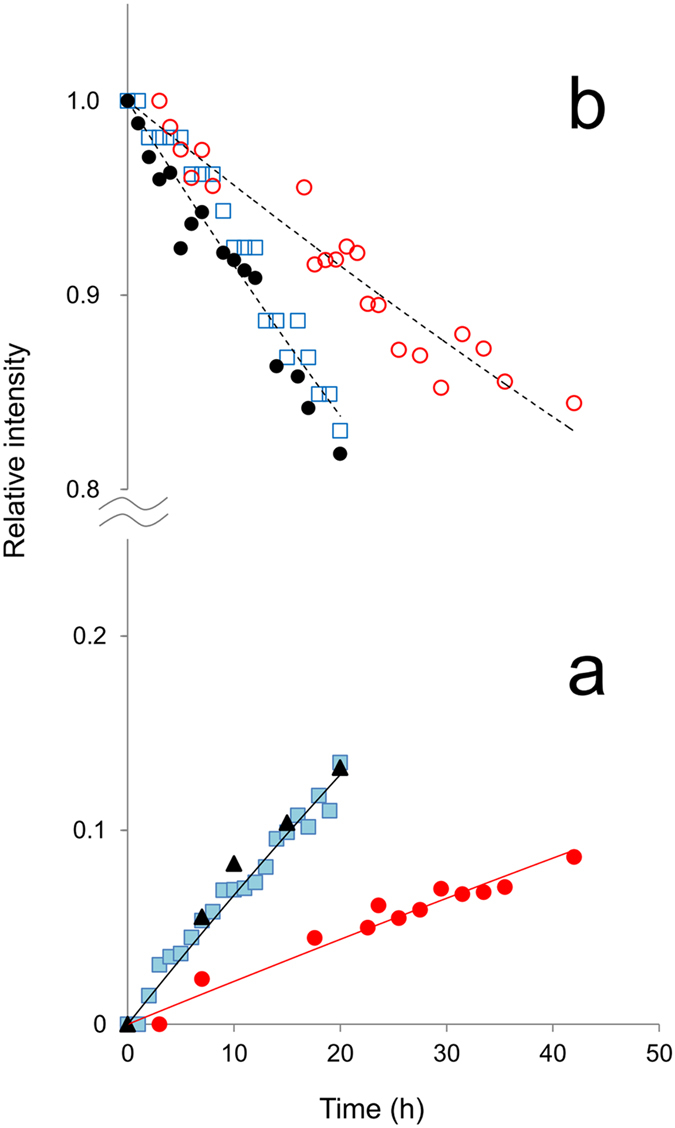
Figure 4. Real time NMR signal intensity change accompanied by the peptide bond cleavage at L-α- and D-β-Asp58 of αA-crystallin 51–60 fragment.

The increase in the products C-terminal L-Asp58 ( ) of 51–58 fragment and N-terminal Ser59 of Ser59-Gly60 (
 ) from the reactant L-α-Asp 51–60 is plotted in (a), together with the increase in N-terminal Ser59 (
 ) from the reactant D-β-Asp 51–60. Each symbol designates integral intensity of the respective signal. In (b), the decrease of the reactant non-terminal L-α-Asp58 evaluated from integral intensities (
 ) and peak heights (
 ) is shown, as well as that of non-terminal D-β-Asp58 estimated from peak heights (
 ). All values are relative to the initial intensities. Black and red solid lines in (a) are the resulting curves obtained by fitting equation 2 to the respective experimental values, from which the rate constants k were estimated. Dashed lines in (b) are only guide for eyes.
