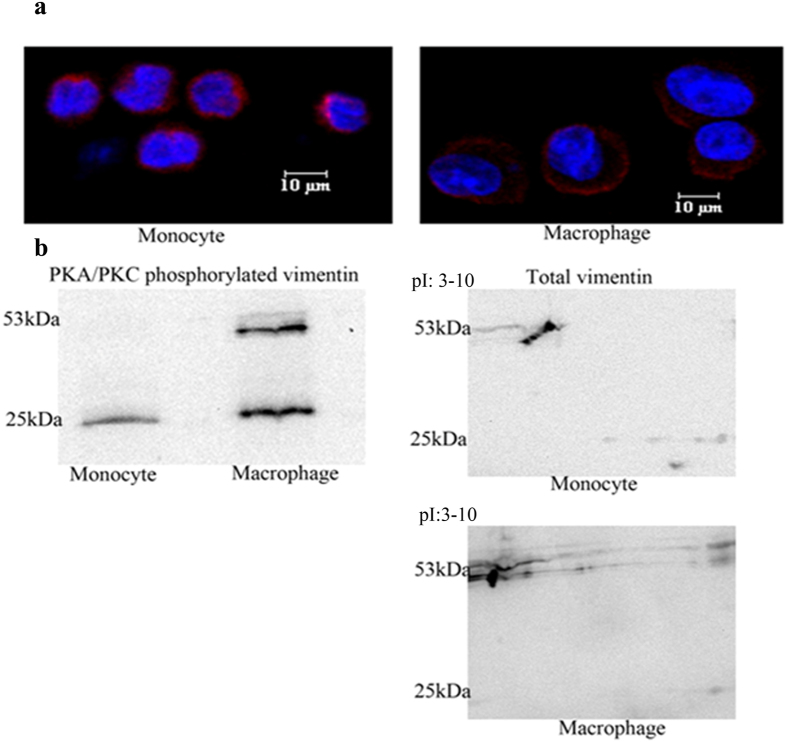
Figure 2. Profile of vimentin in monocytes and macrophages.
(a) Immunofluorescence of vimentin (red) -stained THP1 monocytes and macrophages clearly demonstrating the difference in the distribution between them (b) The left panel shows Western blot of immunoprecipitate from PKA substrate antibody pull down. PKA/PKC phosphorylated molecular size forms of vimentin in monocytes and macrophages demonstrating that phosphorylated proteins around 53 KDa are present only in induced macrophages. The right panel shows Western blots of total vimentin from 2DE experiments showing the presence of both the cluster of spots near to 53 kDa and the 25 kDa form in monocytes as well as in macrophages; the cluster of spots near to 53 kDa in macrophages has shifted left to a more acidic pI compared to monocytes due to phosphorylation.

