Figure 2.

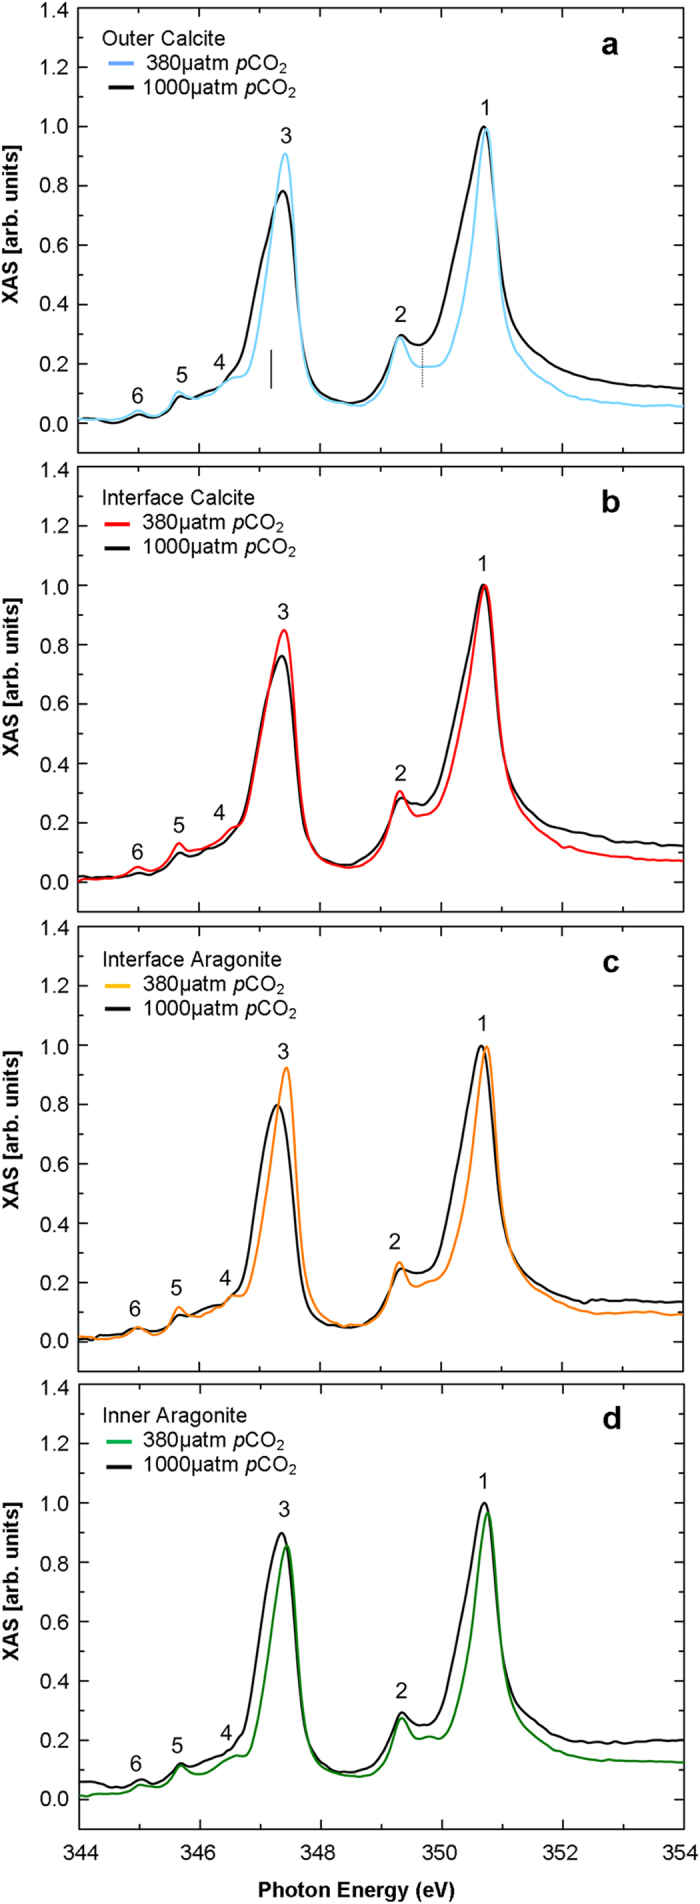
XAS spectra across the Ca L2,3-edge of Mytilus edulis shell grown under present day conditions for (a) the outer calcite, (b) the interface calcite, (c) the interface aragonite and (d) inner aragonite area. The colour of the present day (380 μatm pCO2) solid line corresponds to the area with the same colour circle in Fig. 1. The spectra for each region of the shell grown under OA (1000 μatm pCO2) conditions are shown as the solid black line in each panel. The spectra have been overlaid to highlight the increased ACC presence in shells grown under OA in the areas determined to be calcite and aragonite by XPEEM and EBSD. The six features in the XAS spectra are labelled 1–6. The solid vertical line in (a) indicates the position of the lower energy shoulder indicative of ACC. The dashed vertical line in (a) indicates the position of the peak that increases intensity from the outer calcite to the inner aragonite layer.
