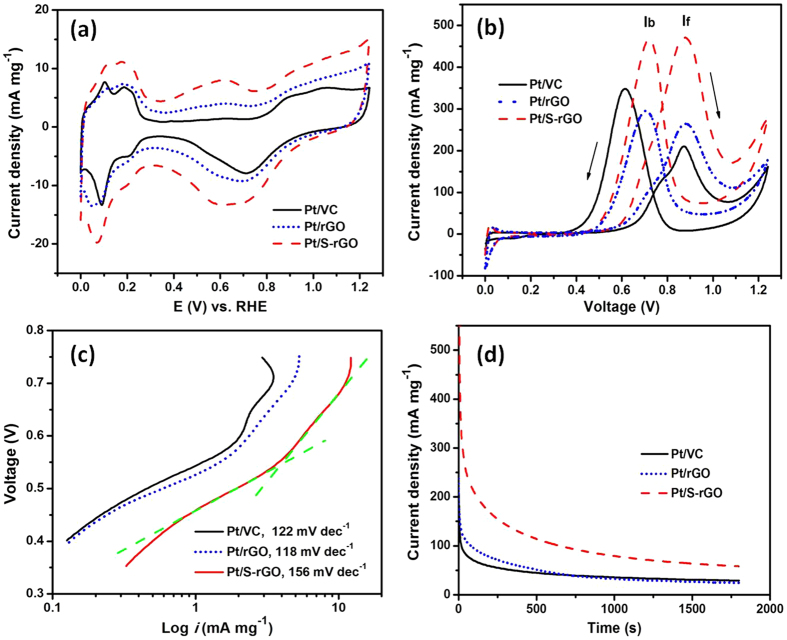
Figure 8.
CV curves of the electrocatalysts (a) in a N2-saturated 0.5 M H2SO4 solution at a scan rate of 20 mV s−1, and (b) in a N2-saturated 0.5 M H2SO4 + 1 M CH3OH solution at a scan rate of 50 mV s−1, (c) Tafel plots at a scan rate of 2 mV s−1 and (d) CA curves at 0.6 V vs. SCE for 1800 s in a N2-saturated 0.5 M H2SO4 + 1 M CH3OH solution. Pt loading was 20 wt.%. The green dotted lines in (c) were used as guide to fit the Tafel plots.

