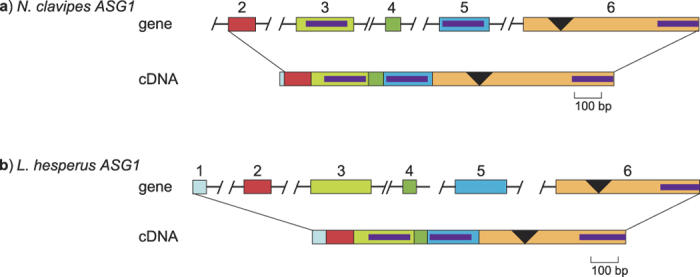
Figure 1.

Comparison of ASG1 gene models to cDNAs for N. clavipes (a) and L. hesperus (b). Boxes represent exons and horizontal lines represent introns. Exons are numbered. Lines show the correspondence of exons to cDNA regions. Slashes indicate unknown sequence between exons. Inverted triangles represent the mucin-like domain, and purple bars represent chitin binding domain 2 (see text). Exon 1 of N. clavipes ASG1 was not captured, but is predicted from the cDNA. GenBank accession numbers are in Table 1.
