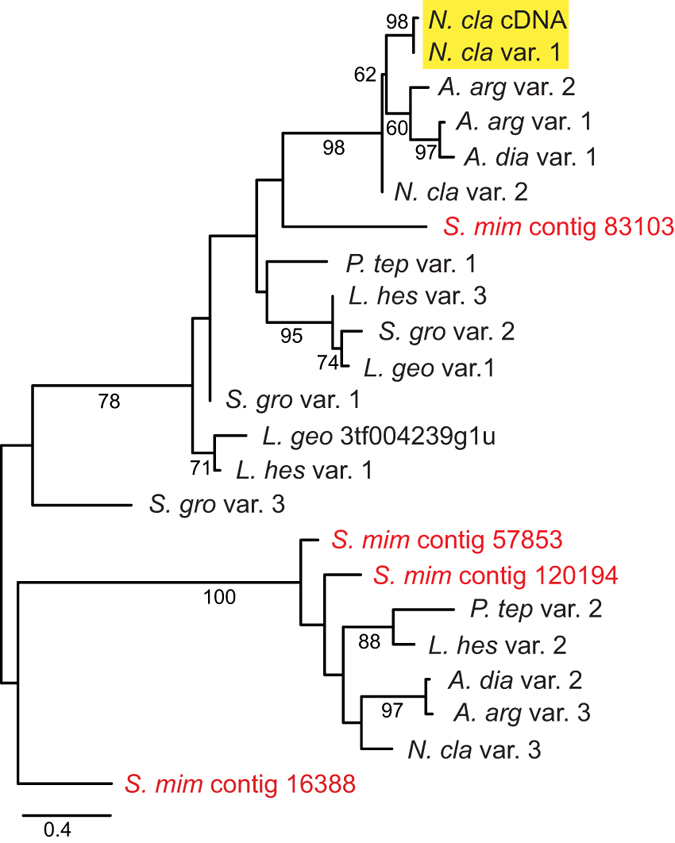
Figure 3. Maximum likelihood tree of the carboxyl-terminal region of ASG1 homologs.

Highlighted box shows N. clavipes ASG1 cDNA and the most closely related ASG1 target capture contig. When there was an identical match between a translated genomic contig and a cDNA transcript, only the genomic contig is shown in the tree (L. hes var. 1 = L. hes contig 682, L. hes var. 2 = L. hes contig 21628, S. gro var. 1 = S. gro 3tf004239g6u, S. gro var. 2 = S. gro 3tf004239g1u). Red names indicate contigs from the Stegodyphus mimosarum genome. Full species names and GenBank accession numbers are in Table 1. Bootstrap percentages >50% are shown. Scale bar indicates 0.4 substitutions per site. Tree is mid-point rooted.
