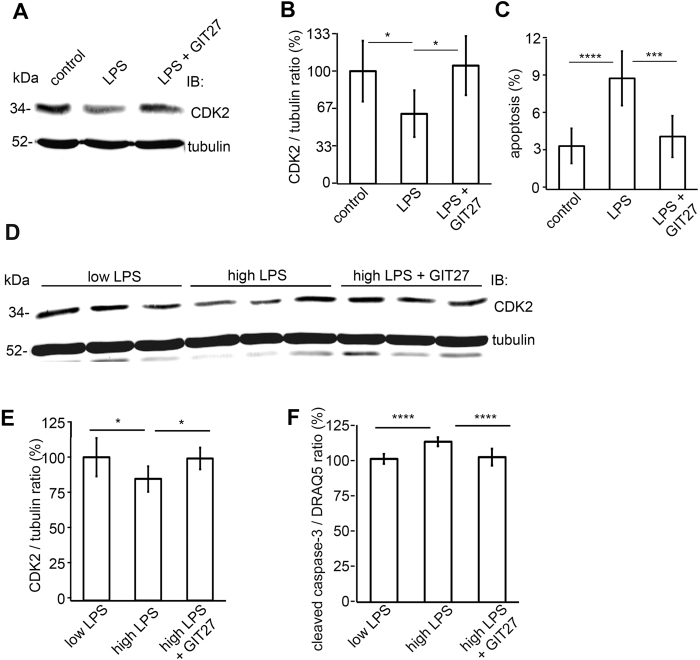
Figure 4. Inhibition of the TLR pathway prevents downregulation of CKD2 and induction of apoptosis in cultured human podocytes treated with LPS or with human sera with high LPS activity.
(A) Representative immunoblot for CDK2 of LPS-treated podocytes with or without GIT27 treatment. Tubulin is included as a loading control. (B) Quantification of CDK2 shows that co-treatment of podocytes with LPS and GIT27 prevents downregulation of CDK2. The experiment was performed three times with three replicates in each experiment. Data are presented as mean ± SD. *p < 0.05 vs. LPS group. (C) Flow cytometry of podocytes stained for Annexin V confirms that co-treatment of podocytes with GIT27 and LPS prevents induction of apoptosis. The experiment was performed three times with three replicates in each experiment. Data are presented as mean ± SD. ***p < 0.001, ****p < 0.0001 vs. LPS group. (D) Representative immunoblot for CDK2 in cultured human podocytes treated with sera with low or high LPS activity, and with or without GIT27 co-treatment. Tubulin is included as a loading control. (E) Quantification of CDK2 from podocytes treated with sera with high or low LPS activity (n = 6 each), or treated with sera with high LPS activity in the presence of GIT27 (n = 6). The expression of CDK2 was lower after treatment with sera with high LPS activity than with low LPS activity. GIT27-treatment prevented downregulation of CDK2 induced by high LPS activity. The experiment was performed three times. Data are presented as mean ± SD. *p < 0.05, vs. high LPS group. (F) Quantification of In-Cell Western of cleaved caspase-3 in podocytes treated with sera with high or low LPS activity with or without GIT27 treatment shows that the expression of cleaved caspase-3 was higher after treatment with high-LPS sera compared to treatment with low-LPS sera. GIT27-treatment prevented the induction of apoptosis. DRAQ5TM was used for normalization. Treatments were performed with sera from individual patients (n = 6 per group). The experiment was performed three times with 32 replicates in each group. Data are presented as mean ± SD, ****p < 0.0001 vs. high LPS group.

