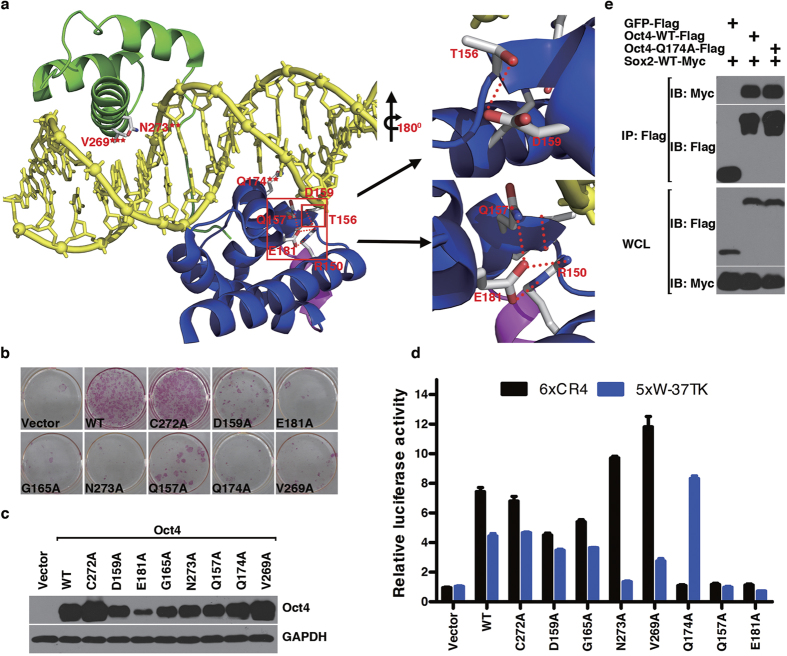
Figure 3. Characterization of mOct4 critical DNA binding residues.
(a) Model of Oct4POU:PORE complex. The POUS domain is shown in blue, the POUHD domain in green, the linker in magenta, and the DNA in yellow. Residues tested in our collection that have atoms within 3.6 Å of DNA (protein-DNA interface) are highlighted. Those making hydrogen bonds to phosphate or DNA bases are labeled with one star or two stars, respectively. V269 is labeled with three stars for its non-polar contacts with DNA base. R150, T156, D159 and E181 are highlighted to show their intra-molecular interactions. Right upper panel shows zoomed-in view of the interaction between D159 and T156. Right lower panel shows zoomed-in view of the interaction among E181, R150 and Q157. Hydrogen bonds are shown by red dot lines. (b) AP staining of reprogramming defective alanine mutants. (c) Protein stability of reprogramming defective alanine mutants in MEFs. (d) The relative transcriptional activity of reprogramming defective alanine mutants was measured using 6xCR4-Luc and 5xW-Luc reporters, respectively. Data are representative of at least three independent experiments. Statistics analysis was performed using a t-test (mean and s.d. of duplicate assays). (e) Interaction of mOct4 Q174A with Sox2 was compared to that of Oct4 WT with Sox2.

