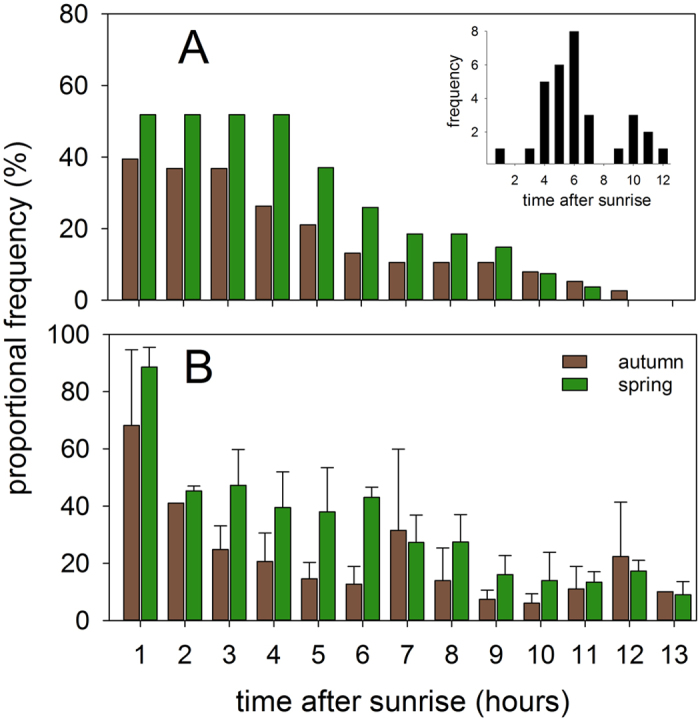
Figure 5. Estimates of proportions of birds with diurnal flights while crossing the Sahara desert and their timing of landing (inset in the upper right corner).

The upper plot (A) shows frequencies of migratory flights into the day estimated from this study (excluding cases when Tmax >92 min) and the lower panel (B) those (mean ± SD) recalculated from a radar field study in the Mauritanian Sahara6.
