Figure 4.
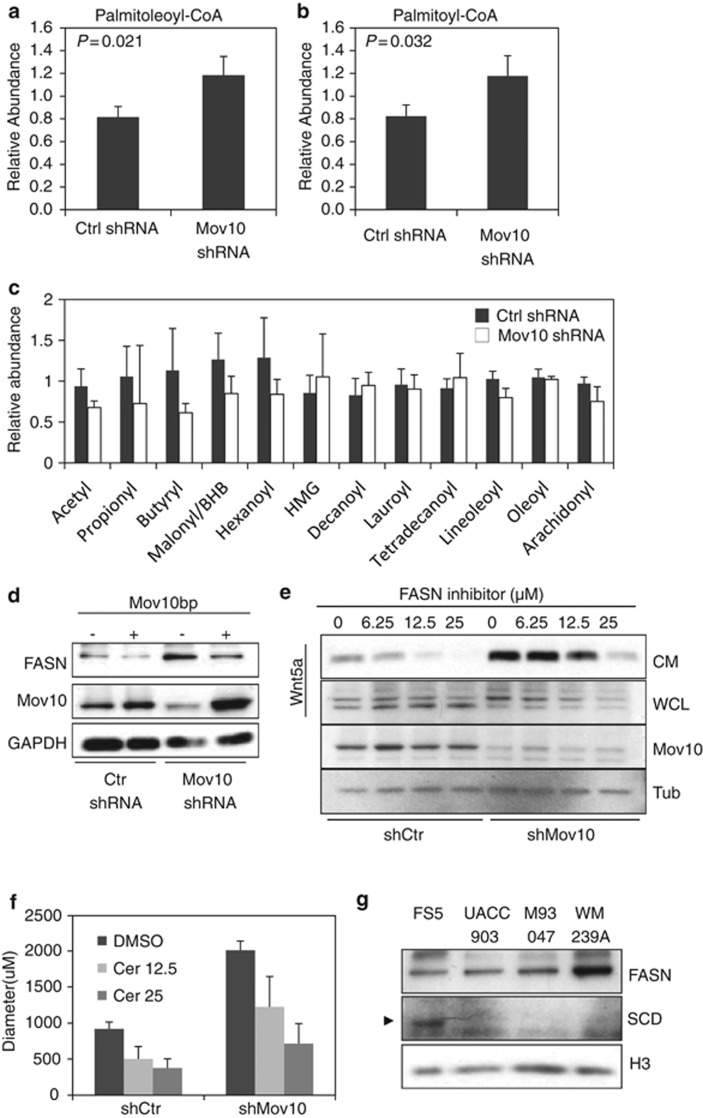
Mov10 inhibition increases levels of palmitoyl-CoA and palmitoleoyl-CoA. (a) Levels of palmitoleoyl-CoA in Mov10 shRNA-expressing UACC903 melanoma cells determined by mass spectrometry. (b) Increased levels of palmitoyl-CoA in Mov10 shRNA-expressing melanoma cells. (c) Profile of acyl-CoA species in control (gray bars) and Mov10 shRNA (white bars)-expressing cells determined by mass spectrometry. (d) FASN protein levels in UACC903 cells expressing Mov10 shRNA, control shRNA or Mov10 shRNA and expressing an shRNA-resistant bypass Mov10 (Mov10bp). (e) Wnt5a secretion in UACC903 melanoma cells expressing Mov10 shRNA treated with the FASN inhibitor cerulenin. Error bars represent the s.d. of four biological replicates. (f) FASN inhibitor cerulenin blocks invasion of UAC903 melanoma cells (dimethyl sulfoxide (DMSO) n=7, cerulenin 12.5 μM n=10, cerulenin 25 μM n=10, P<1 × 10⁻⁷). (g) Melanoma cell lines shown in Figure 1a probed for FASN and SCD. P-values determined by Student's t-test.

