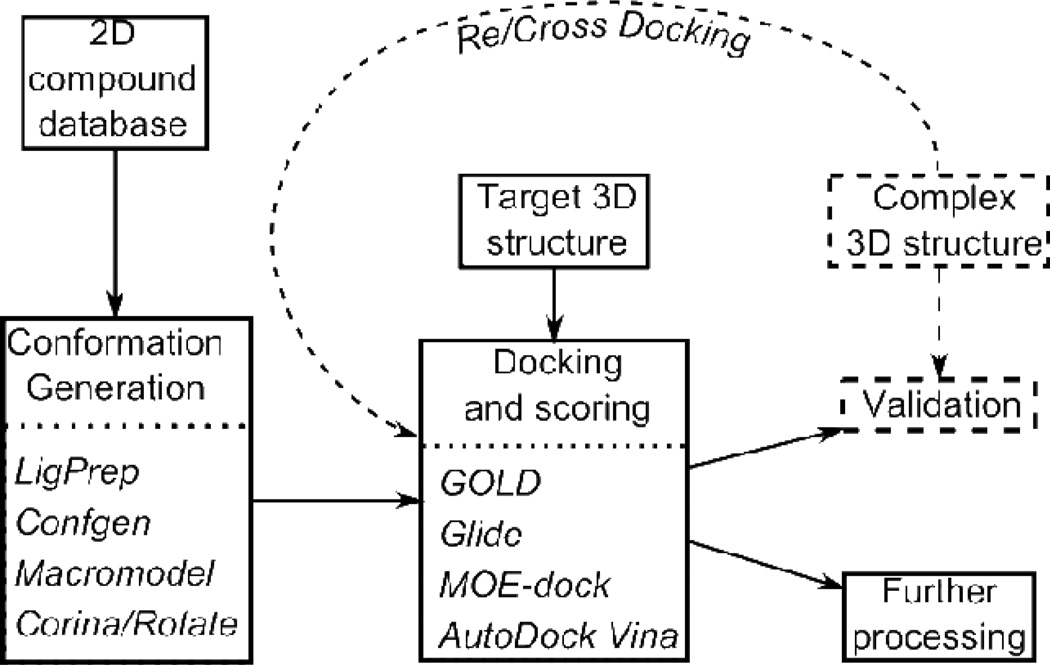
Figure 2.
Flow diagram for virtual screening. The components of the process tested here are the conformation generation and docking components. The specific programs tested are shown in italics. The normal information flow for virtual screening of a compound database is shown with solid arrows. Additional information flow for using a known target—compound complex to test the overall pipeline or its docking component is shown with dashed arrows and a dashed box.

