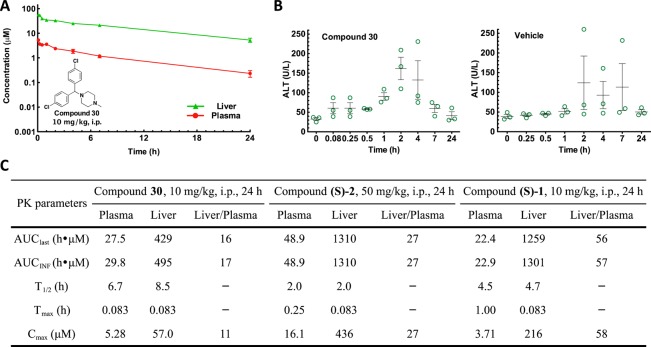
Figure 2.
In vivo pharmacokinetic profiles of the lead compounds. (A) Plasma and liver samples were collected at indicated time points after a single i.p. dosing of compound 30 at 10 mg/kg in a mouse model. Concentrations were measured using UPLC-MS/MS methods. (B) Alanine transaminase level of mouse serum samples collected from the pharmacokinetic study. Results from each mouse are shown with scatter plots, and error bars show the means ± SEM. (C) Pharmacokinetics parameters of compound 30 in comparison with previously reported results of compounds (S)-2 and (S)-1.

