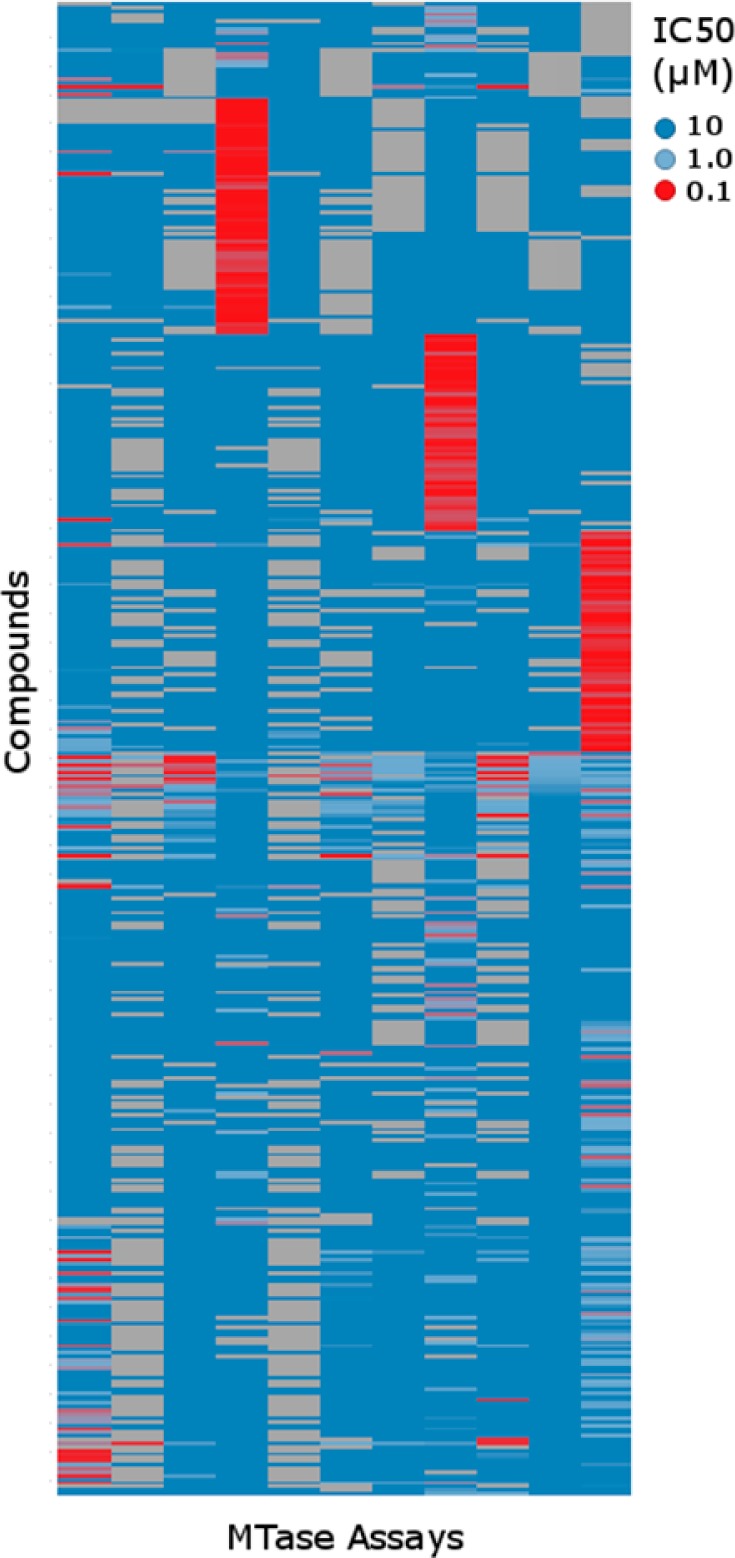
Figure 3.

Selectivity profile of confirmed MTase inhibitors profiled in 11 Cerep MTase assays. These compounds included are literature actives and a set of project compounds with sub-μM activity. The heatmap is colored by compound IC50 in the corresponding assay. Empty values are shown in gray.
