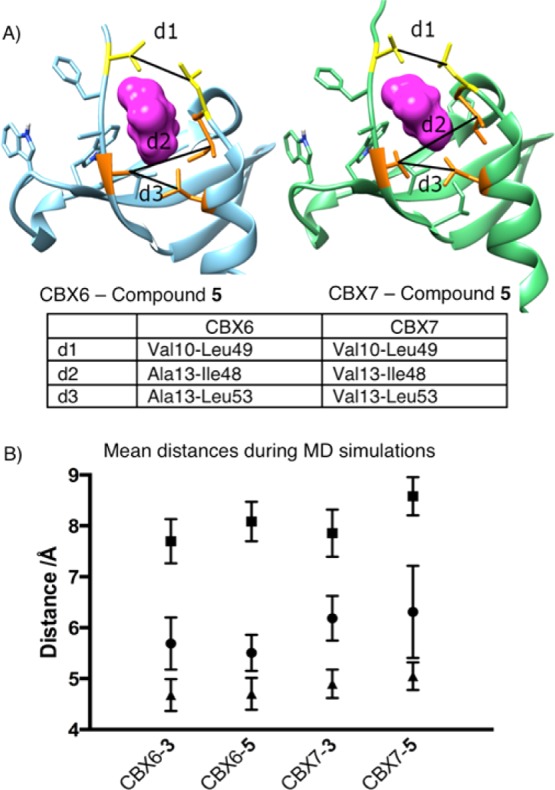
Figure 4.

Molecular dynamic simulation results showing the change in distances within CBX6 and CBX7 when in complex with compounds 3 and 5. (A) Representative snapshots from MD trajectories, showing only those parts of the ligands that occupy the (−2) pocket as magenta surfaces. The distances d1, d2, and d3 define changes in pocket shape that can be compared between simulations (see text). (B) Mean values for distances d1 (circle), d2 (square), and d3 (triangle) show the changes induced in and around the (−2) pocket when the bulkier compound 5 is bound to CBX6 and CBX7. See also the movies of complete MD simulations (Supporting Information).
