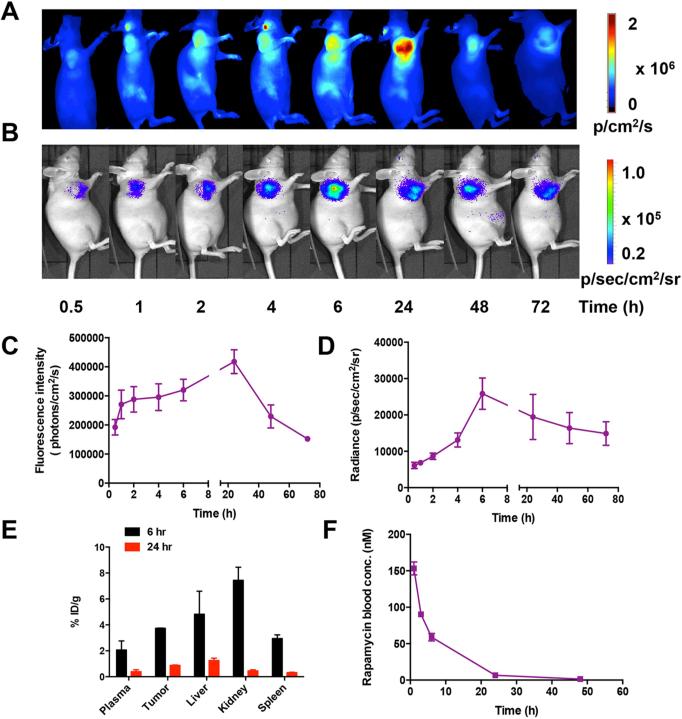
Figure 5.
In vivo imaging and pharmacokinetics analysis of HSA Rapa. Cy5 labeled HSA Rapa (10 mg/kg) was intravenously injected into the HN12#2 tumor bearing mice (n=6). At different time points (0.5, 1, 2, 4, 6, 24, 48, 72 h) after injection, (A) fluorescence imaging was performed following by (B) bioluminescence imaging. (C) The qualification of the fluorescence imaging results. (D) The qualification of the bioluminescence imaging results. (E) After imaging, the tumors and major organs as well as plasma at 6 h or 24 h time point were harvested and subjected to LC-MS analysis. (F) After intravenous injection of HSA Rapa into nude mice with a dosage of 10 mg/kg (n=6), the concentration of rapamycin in the blood over time was measured by LC-MS. Blood was drawn from the tail vein of mice at different time point, and the content of rapamycin was measured at each time point.

