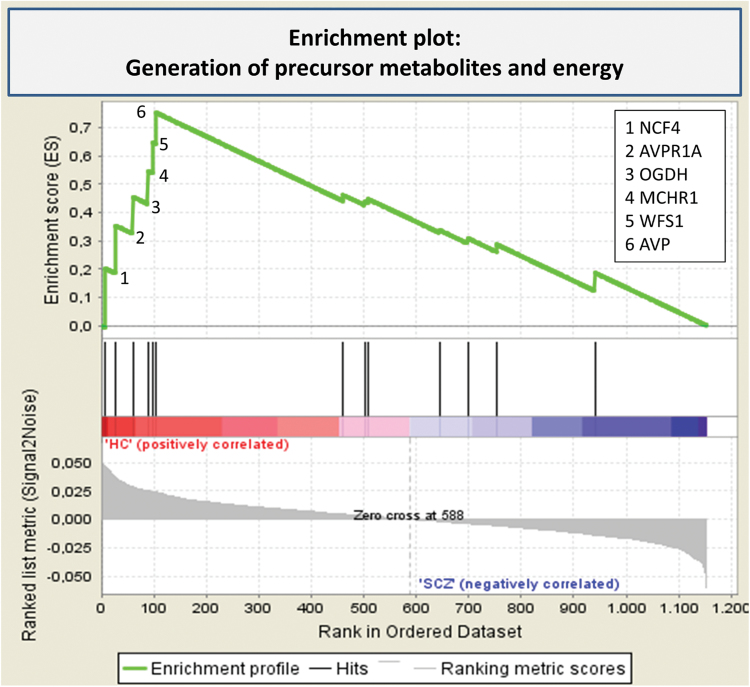
Fig. 2.
Enrichment plot: Generation of precursor metabolites and energy.
Profile of the running enrichment score and positions of gene set members on the rank ordered list (according to association with a diagnosis of schizophrenia). The leading edge subset is the set of genes that appear in the ranked list prior to the peak. For more information, see SM 2.6.

