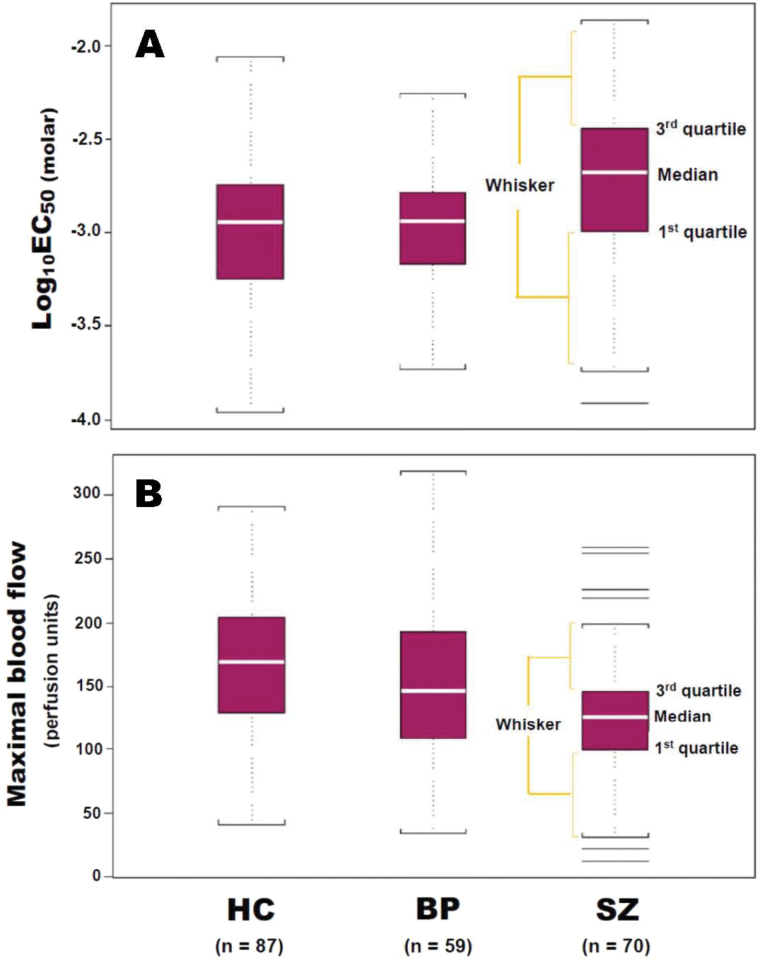
Fig. 2.
Box-Whisker plots of niacin-induced flushing response as expressed as Log10EC50 molar (A) and maximal blood flow (B) values in HC subjects, BP patients, and patients with chronicSZ. In SZ group (B), 4 lines above and 2 lines below the “outer fences” (3 × interquartile range beyond the first or third quartile) indicated outlying values, whose correlation test of normality produced P = .08, was closest to rejecting normality due to more weight in each of the tails. BP, bipolar disorder; HC, healthy controls; SZ, schizopherenia

