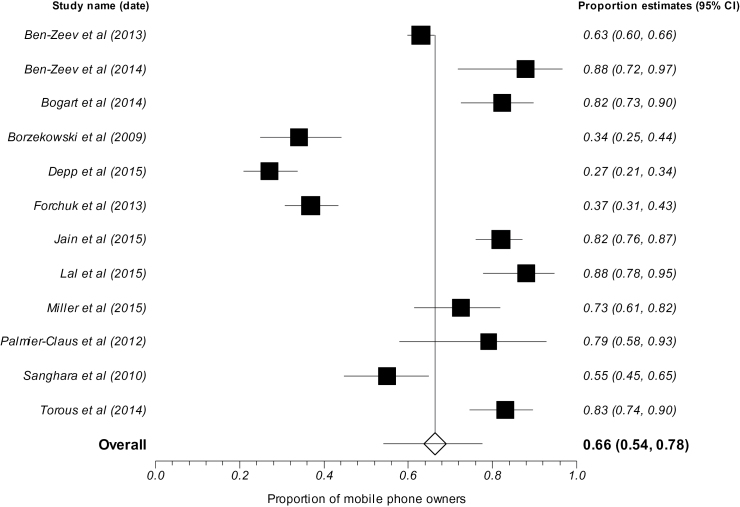
Fig. 2.
Proportional meta-analysis of mobile phone ownership among patients with psychosis. The forest plot shows the mobile phone ownership rates among eligible samples (see “Methods” section) in each study, including each study’s proportion estimate (Box points) and the 95% CI (horizontal lines). The diamond shows the overall ownership rate estimated from a random-effects model.

