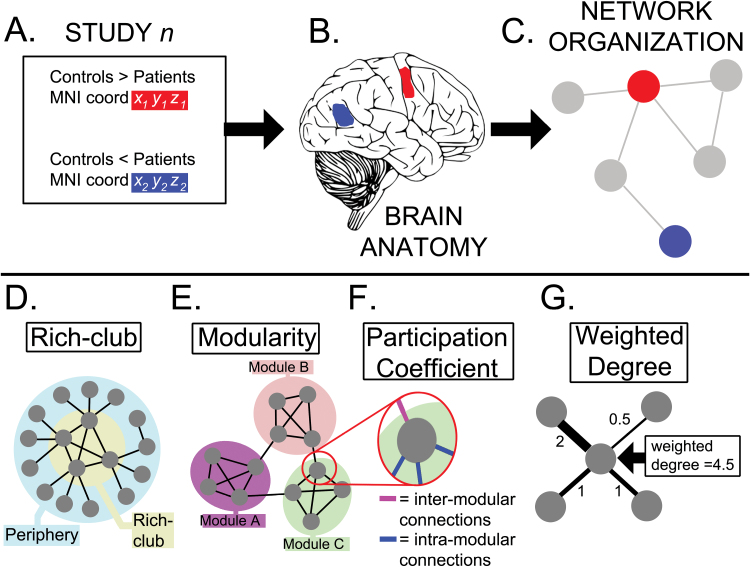
Fig. 1.
Overview of the methods and terminology. (A) The coordinates of under-activations (red) and over-activations (blue) during a task in schizophrenia were retrieved. (B) These were mapped onto regions of interest (ROIs) defined in standard neuroanatomical space. (C) The coordinates were also mapped onto a normative connectome (brain network) based on the same ROIs. This network “mapping” exercise provided information about the position in the network where each differential activation was located. We were particularly interested in the relationship between abnormal activations and specific network configurations such as the rich club (highly connected high degree nodes) (D) or network modules (groups of densely connected nodes that are sparsely connected to nodes in other modules) (E). We also examined their association with the participation coefficient (F), which refers to the relative proportions of intra-modular and inter-modular connections a node mediates, and the weighted degree (G), which is the sum of connections to a node.

