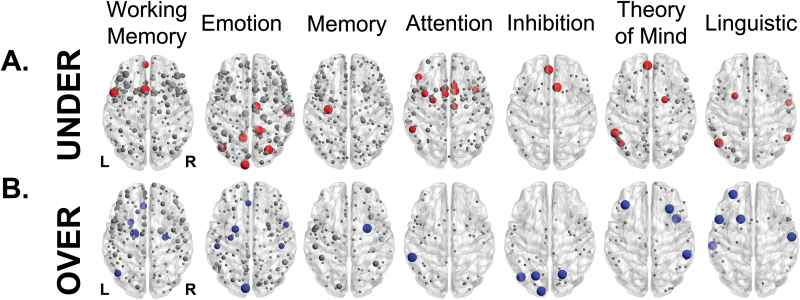
Fig. 3.
Anatomical location of under- and over-activations in schizophrenia elicited by different tasks. Regions sized according to the probability of finding an under-activation (A) or an over-activation (B) in the most frequently reported tasks. Nodes in red/blue represent locations where differential activations were statistically more frequent than the null model (P < .01, uncorrected), and grey nodes where they did not reach statistical significance. Across different tasks, there was no consistency in the anatomical distribution of differential activation.

