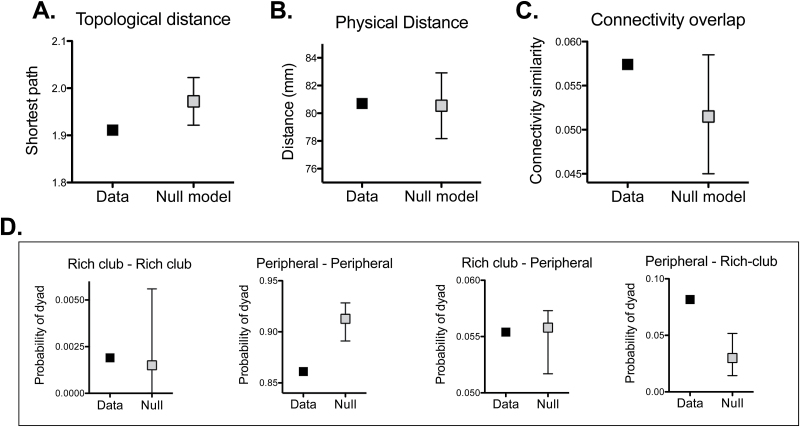
Fig. 5.
Characteristics of dyads of under- and over-activated regions in response to the same task. Topological distance (A), physical distance (B), and similarity between connectivity profiles (C) between pairs of under- and over-activated regions. 95% confidence intervals shown. (D) Post hoc analyses exploring frequencies of the observed dyads and the rich-club/periphery configuration. Graphs are named according to type of region under-activated/ over-activated.

