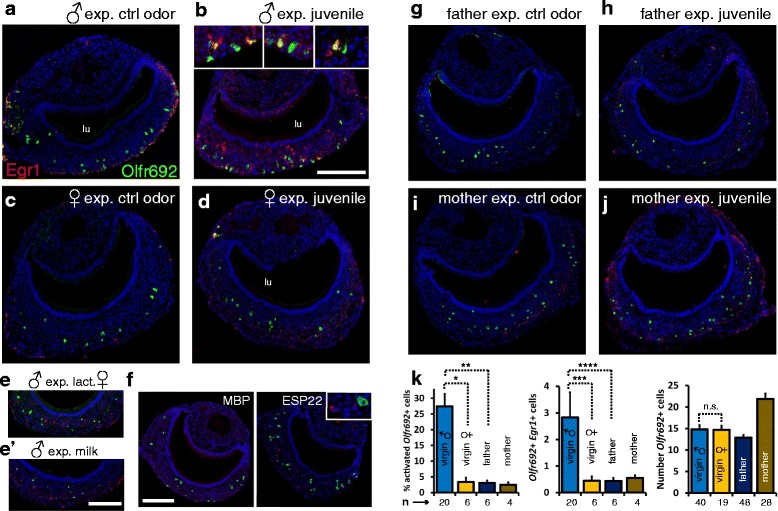
Fig. 6.

Olfr692 cells are activated by juvenile odors in a sexually dimorphic manner and depending on the individual’s social status. (a–j) Double fluorescent in situ hybridization for receptor gene Olfr692 (green) and immediate-early gene Egr1 (red), marker of vomeronasal neuron activation, in adult C57BL/6 virgin males (b), virgin females (d), parenting fathers (h) and mothers (j), exposed to same-strain pup. For h and j, exposure was to alien pups. Insets in b show higher magnification images of activity in Olfr692 cells in virgin males. Virgin males, virgin females, fathers and mothers were also exposed to control odors (a, c, g and i). Lactating female C57BL/6 mice (e) or milk extracted from lactating females (e') activate the VNO of adult male mice (Egr1 staining in red), as compared to control non-exposed animals (a). However, activated cells do not express Olfr692 (green fluorescence). (f) Egr1 expression (red) shows that recombinantly expressed ESP22 juvenile peptidic pheromone does not activate Olfr692 cells (green) in adult C57BL/6 males (right); exposure to MBP, the purification label for ESP22, does not activate the VNO (left). (k) Quantification of labeled cells in experiments shown in a–h. Left panel: percentage of Olfr692 labeled cells per section that are also Egr1-positive (n is the number of mice; * P = 0.0001, two-sample Welch’s t-test assuming unequal variances, t = 5.136; ** P = 0.005, Welch’s t-test, t = 4.407; see also Additional file 7: Table S1 for percentage of Egr1-positive cells among all counted Olfr692 labeled cells). Middle panel: number of Egr1/Olfr692 doubly labeled cells per VNO section (n is the number of mice; *** P = 0.02, two-sample Welch’s t-test, t = 2.474; **** P = 0.02, Welch’s t-test, t = 2.509). Right panel: total number of Olfr692-positive cells per VNO section (n is the number of sections; n.s. = statistically non-significantly different, two-sample t-test, P = 0.461, t = 0.099). Microscopy images are representative from the set of scored sections indicated in Additional file 7: Table S1. Quantification of activation in all experiments is detailed in Additional file 7: Table S1. lu, VNO lumen. Scale bar = 100 μm. In graphs, mean ± SEM
