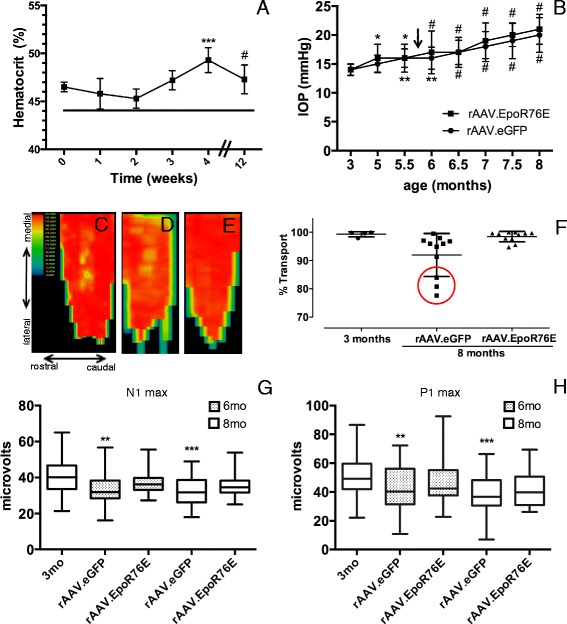
Fig. 1.

Treatment with rAAV.EpoR76E at 5 months protects against vision loss at 6 and 8 months of age. a Graph of hematocrit level over time in mice after systemic injection of rAAV.EpoR76E compared to baseline levels in rAAV.eGFP-injected mice (line) showing a statistically significant increase at 4 and 12 weeks. b Graph of IOP level over time showing a statistically significant increase by 5.5 months of age in both rAAV.eGFP- and rAAV.EpoR76E-treated mice as compared to levels at 3 months of age. There was no difference between treatment groups at any time-point. Arrow indicates when an increase in hematocrit was first detected after gene delivery of EpoR76E. c–e Representative SC fluorescence heat maps of (c) 3-month-old mice, (d) 8-month-old mice treated with rAAV.eGFP, and (e) 8-month-old mice treated with rAAV.EpoR76E. Orientation labels in (c) apply to all heat maps. f Scatter plot of percent axon transport to the SC. The red circle indicates optic nerves with poor axon transport, note the lack of nerves with poor transport in the rAAV.EpoR76E-treated cohort, p < 0.0001 by Bartlett’s test. g Box and whisker plots of fVEP N1 peak amplitude shown as absolute values. h Box and whisker plots of fVEP P1 peak amplitude. The amplitudes in the rAAV.eGFP-treated mice were decreased as compared to 3-month-old controls. There was no statistically significant difference between the rAAV.EpoR76E-treated mice and either other group. *p < 0.05, **p < 0.01, ***p < 0.001, and # p < 0.0001
