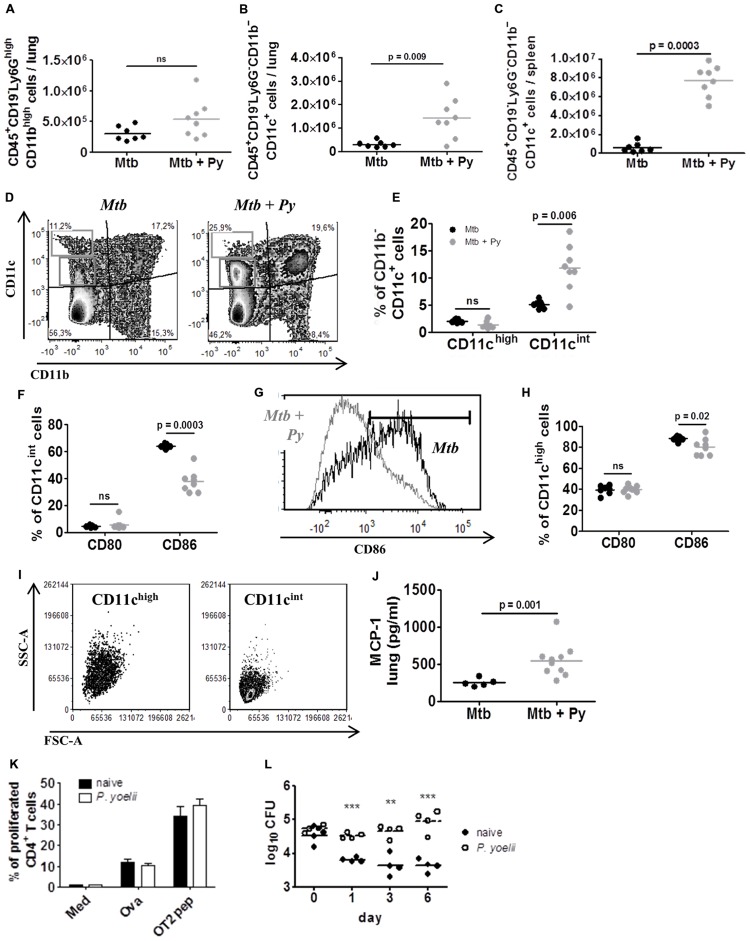
FIGURE 5.
CD11c+ cells are induced by P. yoelii co-infection and promote survival of M. tuberculosis in vitro. C57BL/6 mice were infected via the aerosol route with M. tuberculosis H37Rv, and 30 days later with 1 × 10⁵ iRBCs i.p. Lungs and spleens were collected 21 days after P. yoelii infection and single cell suspensions were analyzed for the presence and activation status of Ly6G+ and CD11c+ cells by flow cytometry. (A) Lung cells were gated on CD45+ and further on CD19– cells and analyzed for the presence of Ly6GhighCD11bhigh neutrophils. Symbols and bars represent individual mice and means, respectively (groups of 7–8). (B) Lung and (C) spleen cells were gated on CD45+ and further on CD19– and Ly6G– cells and analyzed for the presence of CD11b+ and CD11c+ cells. (D–H) Pulmonary CD11b–CD11c+ cells were further divided into CD11cint and CD11chigh (D,E). CD80 and CD86 expression was analyzed in both CD11b–CD11c+ populations (F–H). CD11cint and CD11chigh populations were characterized in size (FSC-A) and granularity (SSC-A) (I). Symbols and bars represent individual mice and means, respectively (n = 7–8; Mann–Whitney test). For full gating strategy, see Supplementary Figure S1D. (J) MCP-1 protein level was measured in lung lysates in M. tuberculosis and co-infected mice using LEGENDplex. (K,L) C57BL/6 mice were infected with P. yoelii and 14 days p.i., CD11c+ cells were isolated from spleens of infected and naïve control mice using magnetically labeled beads. Isolated CD11c+ cells were loaded with the model antigen Ova or Ova-derived peptides and co-cultured with CFSE-labeled transgenic OT-II T cells for 3 days. Loss of CFSE as indicator for T cell proliferation was measured by flow cytometry (K; performed in triplicates). In addition, isolated CD11c+ cells from naïve or malaria infected mice were infected with M. tuberculosis (MOI 1) and plated on 7H11 agar plates at indicated time points (L, one representative experiment out of three). Symbols and bars represent individual mice and means ± SD, respectively. Unpaired student’s t-test. ∗∗p < 0.01, ∗∗∗p < 0.001.

