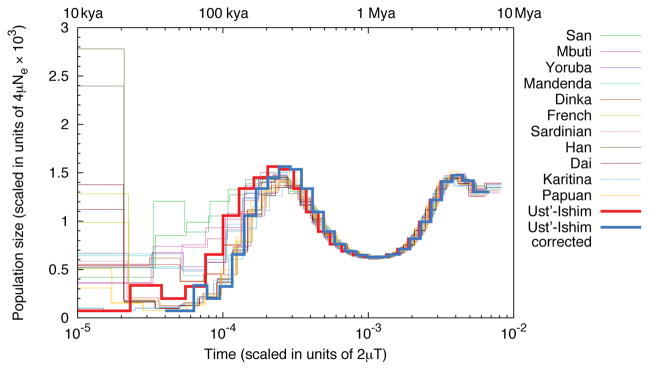
Figure 4.
Inferred population size changes over time. “Time” on the X axis refers to the pairwise per-site sequence divergence. If we erroneously assume that Ust’-Ishim lived today, its inferred population size history includes an out-of-Africa-like population bottleneck that is more recent than that seen in present-day non-Africans (red bold curve). By shifting the Ust’-Ishim curve to align with those in present-day non-Africans (blue bold curve), and assuming that the number of mutations necessary to do this corresponds to 45,000 years, we estimate the autosomal mutation rate to 0.38–0.49 × 10⁻⁹/site/year. The times indicated on the top of the figures, are based on this mutation rate.

