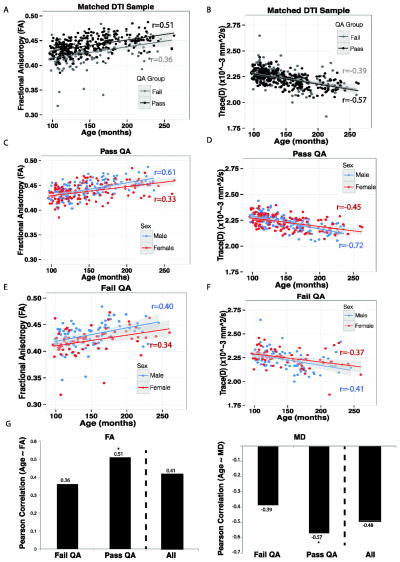
Figure 9.
Pearson correlation coefficients between Age and FA in data failing QA (Poor) and data passing QA (Good+Excellent). A. Data that failed QA had a significantly lower correlation between age and FA as compared to data that passed QA. B. Data that failed QA had a significantly lower correlation between age and MD as compared to data that passed QA. C & D: Correlation between FA and age in males and females in data passing QA. E & F: Correlation between FA and age in males and females in data failing QA. G & H. Summary plot of the correlation between age and DTI metric in data failing QA, passing QA and all data combined. The striped bar shows Pearson correlation when all data is combined. Estimating this association is strongest when data of low quality is excluded from analysis. *p<.05 as compared to Failed QA or All.

