Figure 3.

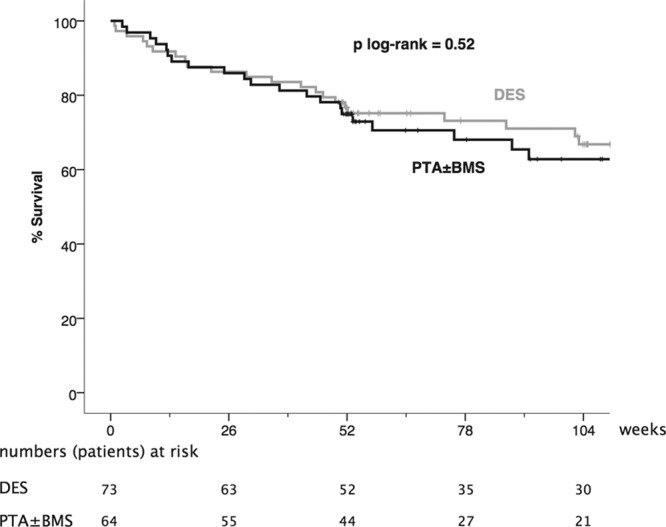
Kaplan–Meier curves representing the estimated 2-year cumulative incidence rates of survival per patient after percutaneous transluminal angioplasty (PTA)±bare metal stent (BMS) and drug-eluting stent (DES).

Kaplan–Meier curves representing the estimated 2-year cumulative incidence rates of survival per patient after percutaneous transluminal angioplasty (PTA)±bare metal stent (BMS) and drug-eluting stent (DES).